
- Title
-
Preventive Effects of Green Tea Extract against Obesity Development in Zebrafish
- Authors
- Zang, L., Shimada, Y., Nakayama, H., Katsuzaki, H., Kim, Y., Chu, D.C., Juneja, L.R., Kuroyanagi, J., Nishimura, N.
- Source
- Full text @ Molecules
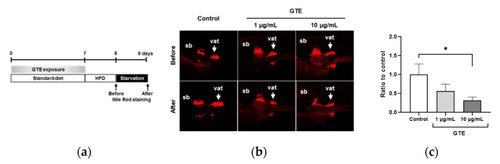
Preventive administration of green tea extract (GTE) suppresses visceral adipose tissue (VAT) accumulation in juvenile zebrafish. (a) Scheme of the experimental design. (b) Representative images from live zebrafish juveniles after performing two Nile red staining processes shown in (a). vat, visceral adipose tissue (VAT); sb, swim bladder; control, HFD-treated control juvenile. (c) Quantification of the intensity of the Nile-red-signal-positive area. The y axis shows the ratio of two Nile red staining processes performed compared with the control group. * p < 0.05 vs. control, n = 5. Error bars indicate the standard deviation (SD). PHENOTYPE:
|
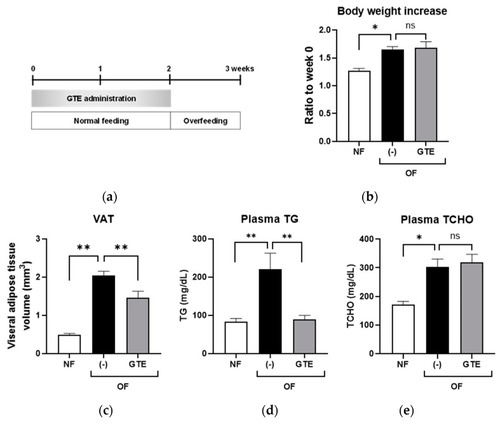
Preventive administration of green tea extract (GTE) reduces VAT volume and decreases plasma triglyceride (TG) levels in adult obese zebrafish. (a) Experimental design scheme using adult zebrafish, (b) change in body weight, (c) change in VAT volume measured by micro-CT, (d) change in plasma TG and (e) TCHO levels. * p < 0.05, ** p < 0.01, n = 5. Error bars indicate the standard deviation (SD). VAT, visceral adipose tissue; micro-CT, micro-computed tomography; TCHO, total cholesterol. |
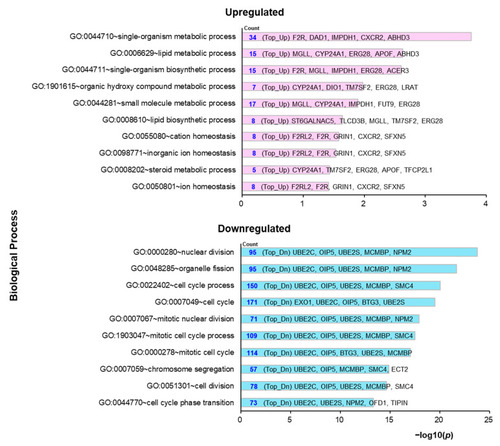
GO pathway analysis for preventive administration of GTE compared with OF. The top 10 enriched GO functions for upregulated (Top_Up, pink) and downregulated (Top_Dn, blue) are shown in the −log10 p-value (−log10(p)). GO, Gene Ontology; GTE, green tea extract; OF, overfeeding. |
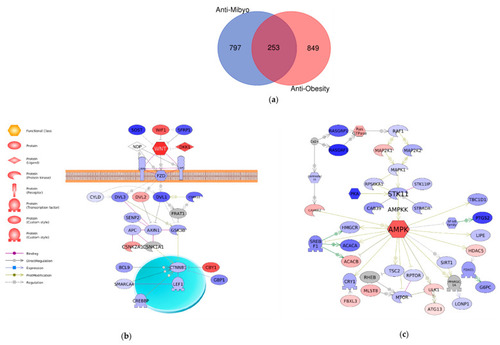
Comparison of the two datasets. (a) A Venn diagram comparing differentially expressed genes in anti-Mibyo and anti-Obesity datasets. (b) Wnt canonical signaling and (c) AMPK signaling were identified using altered genes in the anti-Mibyo dataset. The red and blue colors indicate genes with upregulated and downregulate expression, respectively. Gray denotes genes that were not detected or statistically cut off in the RNA-seq assay. |
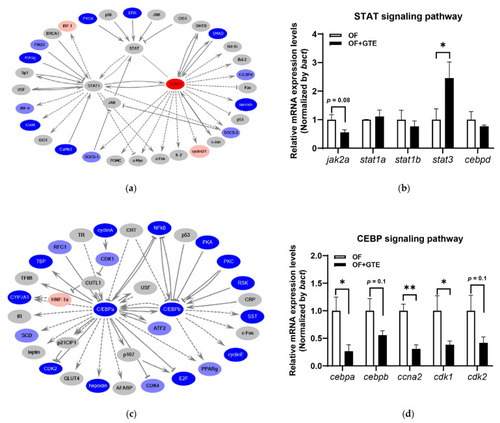
The supposed molecular pathways in the altered gene expression in the anti-Mibyo study. (a) Molecular network of transcription regulation of STAT, (b) selected gene expression level changes in the STAT signaling pathway, (c) molecular network of transcription regulation of CEBP, and (d) selected gene expression level changes in the CEBP signaling pathway. The red and blue colors indicate upregulated and downregulated molecules, respectively. Gray denotes genes that were not detected or statistically cut off in the RNA-seq assay. * p < 0.05, ** p < 0.01 vs. OF group, n = 4. Error bars indicate the standard deviation (SD). STAT, signal transducer and activator of transcription; CEBP, CCAAT enhancer-binding protein. |