
Image
|
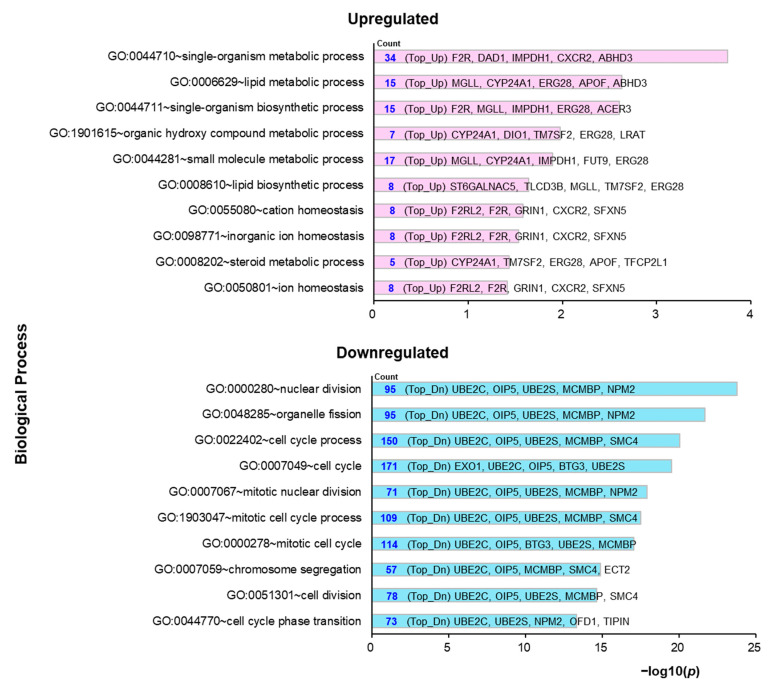
Figure Caption
Figure 3 GO pathway analysis for preventive administration of GTE compared with OF. The top 10 enriched GO functions for upregulated (Top_Up, pink) and downregulated (Top_Dn, blue) are shown in the −log10 p-value (−log10(p)). GO, Gene Ontology; GTE, green tea extract; OF, overfeeding.
Acknowledgments
This image is the copyrighted work of the attributed author or publisher, and
ZFIN has permission only to display this image to its users.
Additional permissions should be obtained from the applicable author or publisher of the image.
Full text @ Molecules