
FIGURE
Figure 3
- ID
- ZDB-FIG-210519-35
- Publication
- Zang et al., 2021 - Preventive Effects of Green Tea Extract against Obesity Development in Zebrafish
- Other Figures
- All Figure Page
- Back to All Figure Page
Figure 3
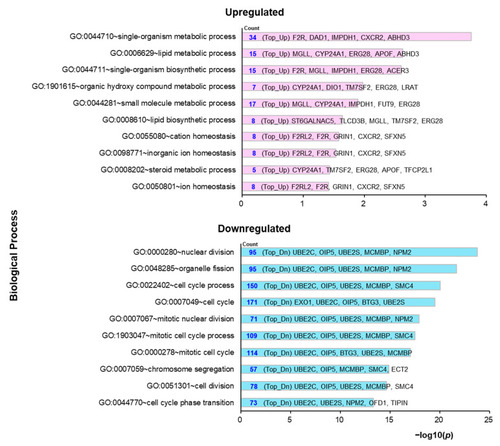
GO pathway analysis for preventive administration of GTE compared with OF. The top 10 enriched GO functions for upregulated (Top_Up, pink) and downregulated (Top_Dn, blue) are shown in the −log10 p-value (−log10(p)). GO, Gene Ontology; GTE, green tea extract; OF, overfeeding. |
Expression Data
Expression Detail
Antibody Labeling
Phenotype Data
Phenotype Detail
Acknowledgments
This image is the copyrighted work of the attributed author or publisher, and
ZFIN has permission only to display this image to its users.
Additional permissions should be obtained from the applicable author or publisher of the image.
Full text @ Molecules