
Figure 5
- ID
- ZDB-FIG-210519-37
- Publication
- Zang et al., 2021 - Preventive Effects of Green Tea Extract against Obesity Development in Zebrafish
- Other Figures
- All Figure Page
- Back to All Figure Page
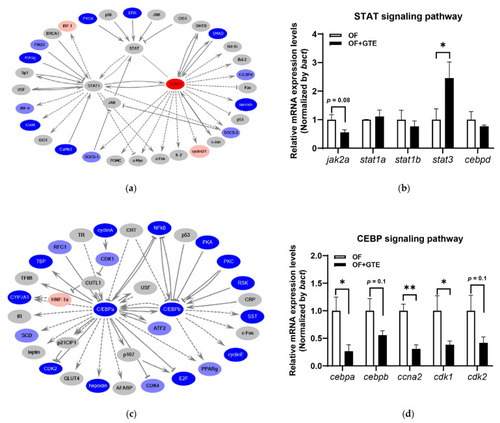
The supposed molecular pathways in the altered gene expression in the anti-Mibyo study. (a) Molecular network of transcription regulation of STAT, (b) selected gene expression level changes in the STAT signaling pathway, (c) molecular network of transcription regulation of CEBP, and (d) selected gene expression level changes in the CEBP signaling pathway. The red and blue colors indicate upregulated and downregulated molecules, respectively. Gray denotes genes that were not detected or statistically cut off in the RNA-seq assay. * p < 0.05, ** p < 0.01 vs. OF group, n = 4. Error bars indicate the standard deviation (SD). STAT, signal transducer and activator of transcription; CEBP, CCAAT enhancer-binding protein. |