
FIGURE
Figure 4
- ID
- ZDB-FIG-210519-36
- Publication
- Zang et al., 2021 - Preventive Effects of Green Tea Extract against Obesity Development in Zebrafish
- Other Figures
- All Figure Page
- Back to All Figure Page
Figure 4
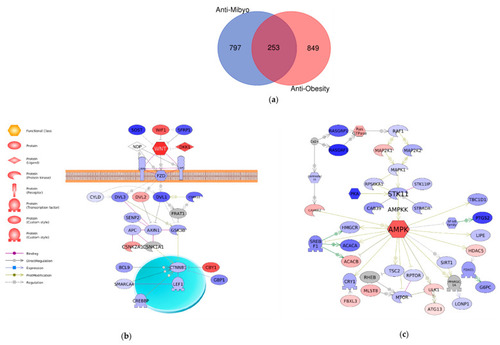
Comparison of the two datasets. (a) A Venn diagram comparing differentially expressed genes in anti-Mibyo and anti-Obesity datasets. (b) Wnt canonical signaling and (c) AMPK signaling were identified using altered genes in the anti-Mibyo dataset. The red and blue colors indicate genes with upregulated and downregulate expression, respectively. Gray denotes genes that were not detected or statistically cut off in the RNA-seq assay. |
Expression Data
Expression Detail
Antibody Labeling
Phenotype Data
Phenotype Detail
Acknowledgments
This image is the copyrighted work of the attributed author or publisher, and
ZFIN has permission only to display this image to its users.
Additional permissions should be obtained from the applicable author or publisher of the image.
Full text @ Molecules