
Fig. 1
- ID
- ZDB-FIG-250327-48
- Publication
- Kondrychyn et al., 2025 - Combined forces of hydrostatic pressure and actin polymerization drive endothelial tip cell migration and sprouting angiogenesis
- Other Figures
-
- Fig. 1
- Fig. 1 - Supplemental 1
- Fig. 1 - Supplemental 2
- Fig. 1 - Supplemental 3
- Fig. 2
- Fig. 3
- Fig. 3 - Supplemental 1
- Fig. 3 - Supplemental 2
- Fig. 3 - Supplemental 3
- Fig. 3 - Supplemental 4
- Fig. 3 - Supplemental 5
- Fig. 3 - Supplemental 6
- Fig. 3 - Supplemental 7
- Fig. 4
- Fig. 4 - Supplemental 1
- Fig. 5
- Fig. 6
- Fig. 7
- All Figure Page
- Back to All Figure Page
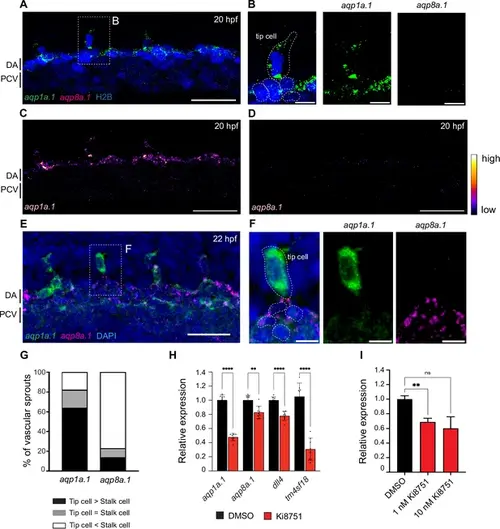
Differential expression of aqp1a.1 and aqp8a.1 mRNAs in tip and stalk cells. (A–F) Detection of aqp1a.1 and aqp8a.1 mRNA by RNAscope in situ hybridization in 20 (A–D) and 22 (E, F) hpf embryos. Representative maximum intensity projection of confocal z-stacks of tip and stalk cells sprouting from DA are shown (n = 9 embryos, two independent experiments). (B) and (F) show magnified region of a tip cell from a 20 hpf and 22 hpf zebrafish, respectively (tip cell and EC nuclei in the DA are outlined). (G) Percentage of vascular sprouts with differential expression of aqp1a.1 and aqp8a.1 mRNA in tip and stalk cells in 22 hpf embryos (n = 23 sprouts from eight embryos, two independent experiments). (H) qPCR analysis of aqp1a.1 and aqp8a.1 expression in zebrafish embryos treated with 0.01% DMSO or 1 µM Ki8751 at 20 hpf for 6 hr (n = 3 independent experiments). (I) qPCR analysis of AQP1 gene expression in human aortic endothelial cells (HAECs) treated with 0.01% DMSO, 1 or 10 nM Ki8751 for 6 hr (n = 2 independent experiments). In panels (H) and (J), gene expressions are shown relative to gapdh expression and data are presented as mean ± SD; statistical significance was determined by Brown–Forsythe and Welch ANOVA tests with Dunnett’s multiple-comparisons test; ns p>0.05, **p<0.01, ***p<0.001, and ****p<0.0001. DA, dorsal aorta; PCV, posterior cardinal vein. Scale bar, 10 µm (B, F) and 40 µm (A, C–E). |