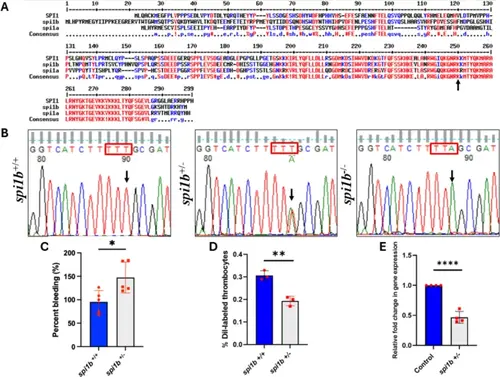
Comparison of Spi1 protein sequences and characterization of spi1b mutant fish. (A) Alignment of the predicted protein sequences of zebrafish Spi1b, Spi1a and human SPI1 transcription factors showing homologies. The amino acids highlighted in red are conserved (high consensus) between zebrafish and humans. Blue indicates low consensus sequences, and black indicates neutral according to the MultAlin program. The black arrow indicates the amino acid lysine replaced by the terminator codon, leading to termination at arginine just before lysine. (B) DNA sequencing of spi1b mutant fish. The DNAs, from adult wild-types (WT) and heterozygotes obtained from the ZIRC were amplified by PCR and resolved on agarose gel electrophoresis. The DNAs from these bands were eluted and sequenced. The heterozygotes were crossed, and the DNA from the progeny 5 dpf larvae was sequenced as described above. Since homozygotes could not be obtained, the heterozygotes were subjected to gill bleeding. Chromatograms of sequences from spi1b +/+, spi1b +/−, and spi1b −/− are shown. Wild-types (WT), heterozygotes and homozygotes had TTT, TTT/TTA, TTA sequences respectively. Note the sequences are in the non-coding strand. (C) Gill bleeding in spi1b +/− mutant fish. In adult spi1b +/− zebrafish, NaOH-induced gill bleeding was photographed, and the red pixel intensities in the photograph measured the bleeding extent. The percentage of gill bleeding of WT controls (spi1b +/+) is represented by blue bars, while spi1b +/− mutant is represented by grey bars. 5 fish were used for KD sample and control experiments (N = 5). (D) DiI-labeled thrombocyte percentages of the WT controls (spi1b +/+) and spi1b +/− mutant. Three fish were used for mutant and control experiments (N = 3). (E) RNA from the liver and spleen from spi1b +/− mutant was reverse transcribed and subjected to qRT-PCR, and the fold change of gene expression was calculated in wild-type controls (blue bars) and spi1b +/− mutant (grey bars). Four fish were used for mutant and control experiments (N = 4). The lines on the top of the bars represent a significant difference between WT and mutant samples. Statistical analysis was performed using Student’s t-test. Error bars represent mean ± SD. *, **, and **** represent p ≤ 0.05, p ≤ 0.01 and p ≤ 0.0001, respectively.
|
