
Fig. 1
- ID
- ZDB-FIG-250318-51
- Publication
- Fallatah et al., 2025 - Piggyback knockdown screening of unique genes of zebrafish young thrombocytes identifies eight novel genes in thrombopoiesis
- Other Figures
- All Figure Page
- Back to All Figure Page
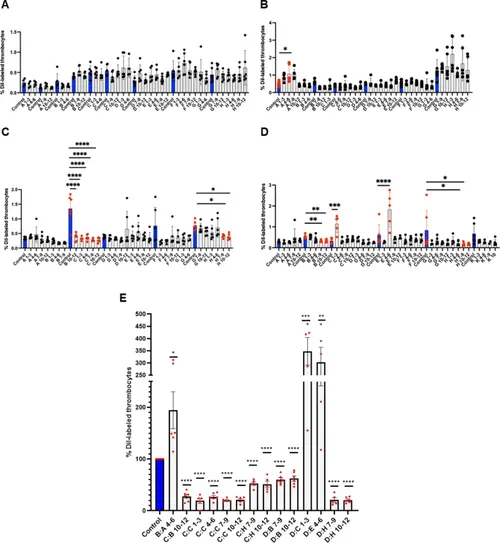
Quantification of DiI-labeled young and mature thrombocytes from flow cytometric data in whole blood after knockdown (KD) of sets of three genes in zebrafish. 394 protein-encoded genes uniquely expressed in RFP + young thrombocytes in adult zebrafish were screened as 132 sets, and DiI-labeled thrombocyte percentage was estimated (A) from set 1 to set 32 (B) from set 33 to set 64 (C) from set 65 to set 96 (D) from set 97 to set 132. (E) the positives from A-D are replotted for easy visualization using a single wild-type (WT) control represented by a blue bar, while all KDs are shown as grey bars to the right of the WT control. Since A-D positives had daily controls, each control value was taken as 100% and the experimental values were normalized to these control percentages and plotted. 4 to 6 fish were utilized for each KD set and controls (N = 4–6). The lines above the bars indicate a significant difference between WT and KD sample sets. One-way ANOVA was used for statistical analysis. Error bars represent mean ± SD. *, **, ***, and **** represent p ≤ 0.05, p ≤ 0.01, p ≤ 0.001, and ≤ 0.0001, respectively. A p-value < 0.05 was considered significant. |