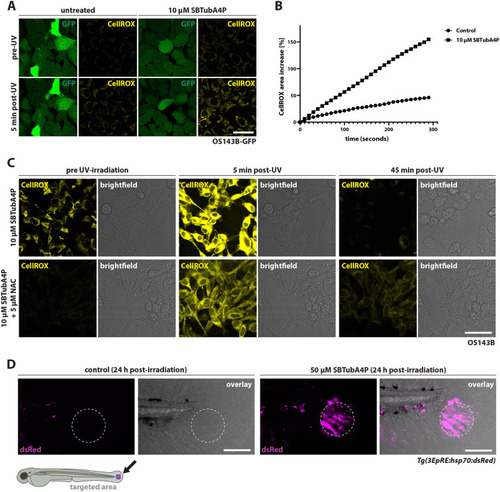
UV illumination of SBTubA4P induces ROS. (A,B) ROS visualization using CellROX. OS143B cells expressing GFP were treated with 10 µM SBTubA4P or left untreated 1 h before UV illumination through laser scanning for 5 min (every 10 s) in the presence of 5 µM CellROX. (A) Representative confocal images from three independent experiments. CellROX fluorescence (yellow) indicates the presence of ROS. Scale bar: 50 µm. (B) Line plot depicting the percentage increase in CellROX fluorescence area over the course of UV illumination (mean values; CellROX area divided by GFP area, normalized to the respective baseline of CellROX area). (C) Antioxidant N-acetyl-L-cysteine (NAC) reduces ROS induction by SBTuBA4P and protects cells from cell death. OS143B cells were treated with 10 µM SBTubA4P with or without 5 µM NAC for 1 h before UV illumination for 5 min in the presence of 5 µM CellROX (see Movies 9 and 10). Representative confocal images from two independent experiments. Scale bar: 25 µm. (D) Transgenic ROS reporter zebrafish strain indicates oxidative stress induced by SBTubA4P in vivo. 3 dpf Tg(3EpRE:hsp70:dsRed) larvae were treated with 50 µM SBTubA4P for 2 h or left untreated before washing, mounting on imaging dishes in agarose and targeted UV irradiation at a circular ROI of 125 µm diameter (depicted by dashed line circles). Representative confocal images (maximum projections: 15 planes, 5 µm spacing) from two experiments (n=10 per condition) were taken 24 h after UV irradiation. DsRed fluorescence appearing in the target region (shown in magenta) indicates response to electrophiles and oxidants. Scale bars: 100 µm.
|
