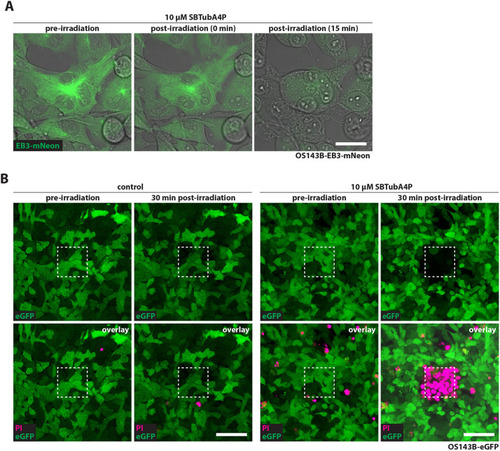
Local illumination of SBTubA4P ablates cancer cells with spatial control in vitro. (A) Repeated SBTubA4P illumination causes blebbing, contraction and swelling of cancer cells. OS143B-EB3-mNeon cells were incubated with 10 µM SBTubA4P for 1 h. Illumination was performed by repeated laser scanning with the 405 nm UV laser diode of a confocal microscope (Leica SP8 WLL) for 3 min (∼15 s between scans). Standstills from the subsequent timelapse (see Movie 2) show the onset of contraction and blebbing of cells (0 min timepoint) followed by swelling and loss of fluorescence (15 min timepoint). Representative confocal images from three independent experiments. Scale bar: 25 µm. (B) Spatially confined SBTubA4P illumination induces localized cell death in OS143B cells. OS143B-eGFP cells were incubated with 10 µM SBTubA4P for 1 h before illumination or left untreated (control). Propidium iodide (PI) solution was added to the medium before imaging. UV irradiation by repeated scanning on a confocal microscope was performed for 5 min in an area of 95×95 µm, depicted by the dashed line squares. PI staining and loss of eGFP fluorescence indicate cell death (see Movies 3 and 4). Representative confocal images (n=3 per condition). Scale bars: 100 µm.
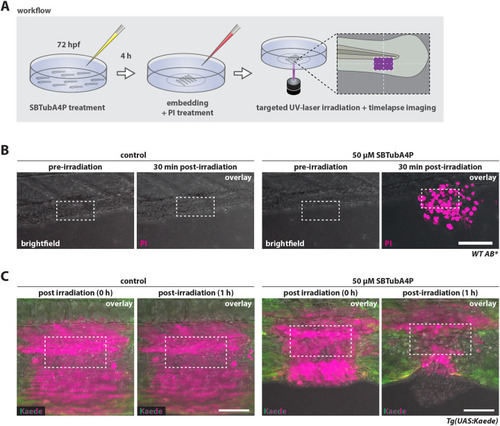
SBTubA4P induces spatially confined cell death in larval zebrafish tissues. (A) Schematic representation of workflow for SBTubA4P-mediated cell ablation in zebrafish larvae in vivo. Zebrafish larvae at 3 days post fertilization (dpf) were incubated with SBTubA4P for 4 h, anesthetized, then washed and embedded in agarose on imaging dishes. Control larvae were not treated with SBTubA4P, but otherwise underwent the same procedure. PI solution was added to the medium before imaging. Targeted illumination was performed by repeated scanning of a defined area using the UV laser diode of a Leica SP8 WLL confocal microscope. hpf, hours post fertilization. (B) Targeted cell ablation through SBTubA4P illumination in live zebrafish tissues. Wild-type (WT) AB zebrafish were treated as outlined in A, targeting an area of 95×47.5 µm (depicted by the dashed line rectangles). PI staining indicates cell death (see Movie 5). Left panel, control zebrafish without SBTubA4P; right panel, zebrafish with SBTubA4P. Representative confocal images from two independent experiments. Scale bar: 100 µm. (C) Embryos of the transgenic line Tg(UAS:Kaede)rk8 were microinjected with 25 pg KalTA4 mRNA at the one-cell stage for ubiquitous Kaede expression. At 3 dpf, larvae were treated with SBTubA4P as outlined in A but without the addition of PI. A rectangular region of interest (ROI) of 95×47.5 µm (depicted by the dashed line rectangles) was UV irradiated in control (left panel) and SBTubA4P (right panel) larvae. Red fluorescence (shown in magenta) indicates the area affected by UV through photoconversion of Kaede (see Movie 6). Representative confocal images (n=3 per condition). Scale bars: 50 µm.
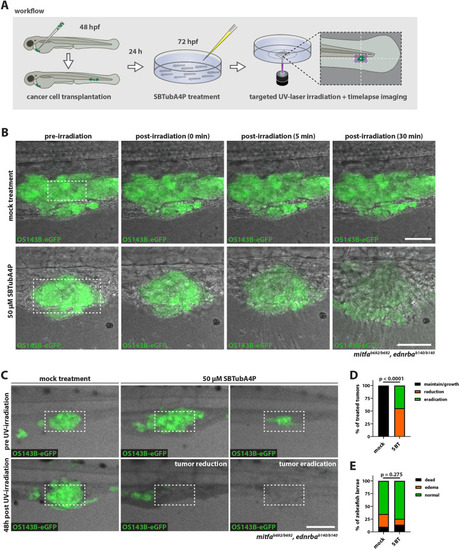
Targeted SBTubA4P illumination eliminates metastases in vivo. (A) Schematic representation of the workflow for SBTubA4P-mediated ablation of disseminated tumor cells in a zebrafish xenograft model. Transplantation of cancer cells into the perivitelline space was performed at 2 dpf. After 24 h [1 day post injection (dpi)], larvae were selected for disseminated tumor cells in the caudal hematopoietic tissue (CHT), treated with 50 µM SBTubA4P for 4 h, anesthetized, washed and mounted for spatially targeted UV irradiation. Mock-treated controls were not treated with SBTubA4P. Single microtumors in the CHT were targeted by repeated UV scanning of a rectangular ROI over the course of 10 min. (B) SBTubA4P illumination induces rapid cell death in xenografted tumor cells. OS143B-xenotransplanted zebrafish larvae at 1 dpi were treated as outlined in A. The subsequent timelapse after UV illumination reveals induction of spatially confined tissue damage at the targeted area, with loss of eGFP expression and extrusion of cells over the course of 30 min in SBTubA4P-treated larvae (see Movie 7). Dashed line rectangles indicate the targeted ROI (70×35 µm). Representative confocal images from two independent experiments (n=3-4 per condition). Scale bars: 50 µm. (C) SBTubA4P illumination ablates OS143B xenograft microtumors in vivo (see Movie 8). Zebrafish larvae at 1 dpi were treated as outlined in A, then removed from the imaging dishes, washed and kept until 5 dpf (48 h post treatment) for follow-up imaging. Dashed line rectangles indicate areas targeted by UV irradiation (140×70 µm). Representative confocal images (maximum projections: ten planes, 5 µm spacing) from three independent experiments. Scale bar: 100 µm. (D) Quantification of SBTubA4P-mediated OS143B tumor treatment efficacy. Chi-squared test was performed for comparison of mock and SBTubA4P (SBT) treatments on outcome: maintenance or growth, reduction and total eradication of tumor masses. Stacked bars represent fractions of total larvae from three independent experiments (mock, n=21; SBT, n=18). (E) Quantification of SBTubA4P treatment toxicity following xenograft tumor treatment (OS143B and SK-N-MC cells). Chi-squared test was performed for comparison of mock and SBTubA4P treatment toxicity, scoring for occurrence of dead larvae, edema formation or no adverse effects. Stacked bars represent fractions of total larvae from five independent experiments (mock, n=40; SBT, n=43).
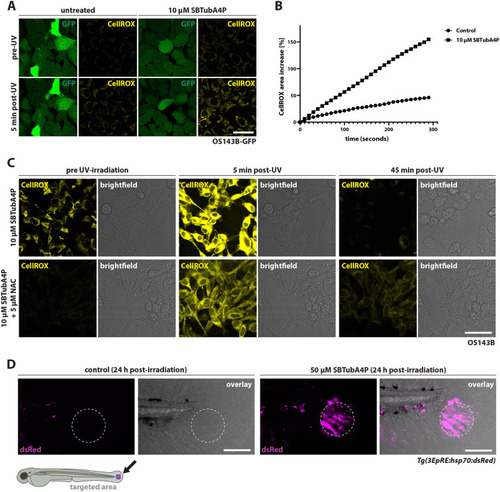
UV illumination of SBTubA4P induces ROS. (A,B) ROS visualization using CellROX. OS143B cells expressing GFP were treated with 10 µM SBTubA4P or left untreated 1 h before UV illumination through laser scanning for 5 min (every 10 s) in the presence of 5 µM CellROX. (A) Representative confocal images from three independent experiments. CellROX fluorescence (yellow) indicates the presence of ROS. Scale bar: 50 µm. (B) Line plot depicting the percentage increase in CellROX fluorescence area over the course of UV illumination (mean values; CellROX area divided by GFP area, normalized to the respective baseline of CellROX area). (C) Antioxidant N-acetyl-L-cysteine (NAC) reduces ROS induction by SBTuBA4P and protects cells from cell death. OS143B cells were treated with 10 µM SBTubA4P with or without 5 µM NAC for 1 h before UV illumination for 5 min in the presence of 5 µM CellROX (see Movies 9 and 10). Representative confocal images from two independent experiments. Scale bar: 25 µm. (D) Transgenic ROS reporter zebrafish strain indicates oxidative stress induced by SBTubA4P in vivo. 3 dpf Tg(3EpRE:hsp70:dsRed) larvae were treated with 50 µM SBTubA4P for 2 h or left untreated before washing, mounting on imaging dishes in agarose and targeted UV irradiation at a circular ROI of 125 µm diameter (depicted by dashed line circles). Representative confocal images (maximum projections: 15 planes, 5 µm spacing) from two experiments (n=10 per condition) were taken 24 h after UV irradiation. DsRed fluorescence appearing in the target region (shown in magenta) indicates response to electrophiles and oxidants. Scale bars: 100 µm.
Acknowledgments
This image is the copyrighted work of the attributed author or publisher, and
ZFIN has permission only to display this image to its users.
Additional permissions should be obtained from the applicable author or publisher of the image.
Full text @ Dis. Model. Mech.
Your Input Welcome
Thank you for submitting comments. Your input has been emailed to ZFIN curators who may contact you if
additional information is required.
Oops. Something went wrong. Please try again later.