
Fig. 6
- ID
- ZDB-FIG-250227-18
- Publication
- Abello et al., 2024 - Endothelial cell Piezo1 promotes vascular smooth muscle cell differentiation on large arteries
- Other Figures
- All Figure Page
- Back to All Figure Page
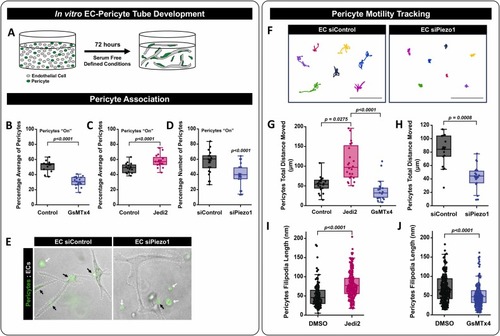
3D in vitro modeling of endothelial cell and pericyte interactions can be regulated by Piezo1 activity. A) Schematic representation of our 3D cell culture model. HUVECs (EC) and GFP-HBVPs (pericyte) were seeded in a 5:1 ratio, respectively, in a 3D collagen type I gel and allowed to self-assemble for 72 hours. Piezo1 activity was modulated pharmacologically by treating the cell cultures with 400 nM Jedi2 or 50 nM of GsMTx4 versus DMSO (control) or by siRNA suppression of EC Piezo1 (siPiezo1) versus an siRNA control (siControl). After 72 hours of incubation, pericyte association with EC tubes was evaluated. B) Quantification of pericyte colocalization with EC tubes under treatments with control (water) and GsMTx4. (p = 0.0001, N = 15 independent cultures). Statistical analysis was performed using a two-tail unpaired t-test. C) Quantification of pericyte colocalization with EC tubes under treatments with control (DMSO) and Jedi2. (p = 0.0001, N = 3–5 independent cultures). Statistical analysis was performed using a two-tail unpaired t-test. D) Quantification of pericyte colocalization with EC tubes following EC specific treatment with Piezo1 siRNA (p = 0.0001, N = 30 independent cultures). Statistical analysis was performed using a two-tail unpaired t-test. E) Representative images of EC/GFP-pericyte cocultures. EC tubes are outlined by the white dashed line, and GFP-pericytes are green in siControl and EC siPiezo1 conditions. F) Representative cell tracking plots of GFP-pericytes in 3D cocultures over 48 hours. G,H) Quantification of GFP-pericyte total motility in 3D cocultures, obtained from 48-hour time-lapse video tracking of cultures treated with (H) Jedi2 (p = 0.00275) or GsMTx4 (N = 12–25 independent cells); or (G) EC siPiezo1 cultures (p = 0.0001, N = 24 independent cells). Statistical analysis was performed using one way ANOVA with a Tukey’s multiple comparison test. I,J) Quantification of GFP-pericyte filipodia length in 3D cocultures (I) DMSO vs Jedi2 (p = 0.0001, N = 200 cells), (J) DMSO vs. GsMTx4 (p = 0.0001, N = 200 cells). Phenotypes were assessed after 72 hours in Jedi2 (I) GsMTx4 (J). Statistical analysis was performed using a two-tail Mann-Whitney test. Scale bar = 50 μm. |