
Fig. 2
- ID
- ZDB-FIG-250227-14
- Publication
- Abello et al., 2024 - Endothelial cell Piezo1 promotes vascular smooth muscle cell differentiation on large arteries
- Other Figures
- All Figure Page
- Back to All Figure Page
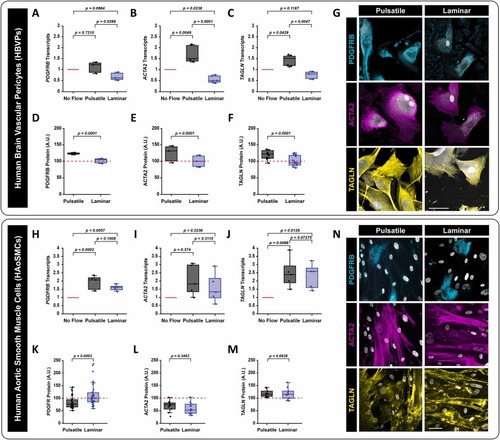
Blood flow type influences mural cell differentiation in vitro. A-C) qPCR transcript levels in HBVPs of mural cell differentiation markers after 24 hours of laminar or pulsatile flow—(A) platelet-derived growth factor receptor beta PDGFRB (p = 0.0399, uncorrected Fisher’s LSD; N = 3); (B) alpha-smooth muscle actin (ACTA2) (p = 0.0001, uncorrected Fisher’s LSD; N = 5); and (C) Transgelin (TAGLN) (p = 0.0047, uncorrected Fisher’s LSD; N = 3). All data is normalized to GAPDH. D-F) Quantification of relative protein levels of mural cell differentiation markers via immunostaining analysis in HBVPs after 24 hours of laminar or pulsatile flow—(D) platelet-derived growth factor receptor beta (PDGFRB) (p = 0.0001, uncorrected Fisher’s LSD; N = 3); (E) alpha-smooth muscle actin (ACTA2) (p = 0.0001, uncorrected Fisher’s LSD; N = 5); and (F) Transgelin (TAGLN) (p = 0.0001, uncorrected Fisher’s LSD; N = 3). G) Representative images of PDGFRB, ACTA2, and TAGLN immunostaining following HBVP-GFP exposure to different flow types for 24 hours. GFP-HBVPs are shown in grey. scale bar = 50 μm. H-J) qPCR transcript levels in HAoSMCs of mural cell differentiation markers after 24 hours of laminar or pulsatile flow—(H) platelet-derived growth factor receptor beta PDGFRB (p = 0.1008, uncorrected Fisher’s LSD; N = 3); (I) alpha-smooth muscle actin (ACTA2) (p = 0.3115, uncorrected Fisher’s LSD; N = 5); and (J) Transgelin (TAGLN) (p = 0.7275 uncorrected Fisher’s LSD; N = 3). All data is normalized to GAPDH. K-M) Quantification of relative protein levels of mural cell differentiation markers via immunostaining analysis in HAoSMCs after 24 hours of laminar or pulsatile flow—(K) PDGFRB (p = 0.0035, unpaired two-tailed t-test; N = 3); (L) ACTA2 (p = 0.3463, unpaired two-tailed t-test t; N = 5); and (M) TAGLN (p = 0.6838, unpaired two-tailed t-test; N = 3). N) Representative images of PDGFRB (cyan), ACTA2 (magenta), and TAGLN (yellow) immunostaining following HAoSMC exposure to different flow types for 24 hours. Culture nuclei (both ECs and HAoSMCs) are shown in grey. scale bar = 50 μm. |