
- Title
-
Endothelial cell Piezo1 promotes vascular smooth muscle cell differentiation on large arteries
- Authors
- Abello, J., Yin, Y., Zhao, Y., Maurer, J., Lee, J., Bodell, C., Richee, J., Clevenger, A.J., Burton, Z., Goeckel, M.E., Lin, M., Grainger, S., Halabi, C.M., Raghavan, S.A., Sah, R., Stratman, A.N.
- Source
- Full text @ Eur. J. Cell Biol.
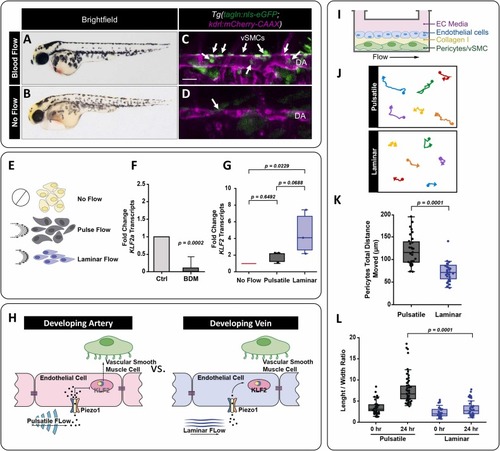
Pulsatile versus continuous laminar flow differentially regulates klf2 expression and mural cell behavior. A,B) 4 dpf zebrafish embryo with normal blood flow (A) compared to a sibling zebrafish treated with 20 mM of BDM (2,3-butanedione monoxide) at 48 hours to stop the blood flow (B). C,D) Confocal image of the medial trunk of a 4 dpf Tg(tagln:nls-eGFP; kdrl:mCherry-CAAX) zebrafish with normal blood flow (C) versus those treated with BDM (D). The endothelium is pseudo colored magenta, and tagln+ smooth muscle cell nuclei are shown in green and identified by the white arrows. DA: dorsal aorta; scale bar = 50 μm. E) Schematic representation of no flow, pulsatile flow, and laminar flow conditions. The arrows indicate the direction of flow at a given time, and the schematics the relative orientation of the cells to the direction of flow. F) qPCR analysis of klf2a transcript levels in 48 hpf zebrafish embryos with and without blood flow. The data is normalized to the ‘with blood flow’ control condition. (p = 0.0002, N = 3 experiments). G) KLF2 transcript levels in HUVECs exposed to pulsatile or continuous laminar flow normalized to the no flow condition. Expression of KLF2 in the laminar flow condition was statistically significant compared with the no flow control; (p = 0.0229, N = 3 experiments). Statistics were analyzed using the nonparametric Kruskal-Wallis test with Dunn’s multiple comparison test. H) The schematic representation shows the proposed relationship between blood flow types, mechanical forces, and different patterns of vSMC association that occur between arteries and veins. We hypothesize that Piezo1 is the mechanosensor responsible for sensing hemodynamic forces, playing a role in vSMC association and differentiation. I) Schematic representation of the experimental setup for the endothelial cells and pericytes flow co-culture studies. J) Representative tracking of HBVP-GFP movements under laminar versus pulsatile flow. The filled circle marks the start of the track and the arrowhead at the end. K) Quantification of HBVP-GFP total movement under pulsatile (N = 38) or continuous laminar (N = 33) flow. Unpaired t-test (p = 0.0001). L) Average HBVP-GFP length-to-width aspect ratios at 0 hours or after 24 hours under pulsatile versus laminar flow. Statistical analysis was performed using Kruskal-Wallis test with Dunn’s multiple comparison test (p = 0.0001, N = 63). |
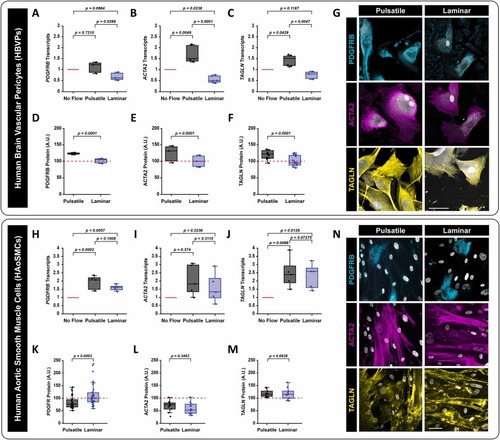
Blood flow type influences mural cell differentiation in vitro. A-C) qPCR transcript levels in HBVPs of mural cell differentiation markers after 24 hours of laminar or pulsatile flow—(A) platelet-derived growth factor receptor beta PDGFRB (p = 0.0399, uncorrected Fisher’s LSD; N = 3); (B) alpha-smooth muscle actin (ACTA2) (p = 0.0001, uncorrected Fisher’s LSD; N = 5); and (C) Transgelin (TAGLN) (p = 0.0047, uncorrected Fisher’s LSD; N = 3). All data is normalized to GAPDH. D-F) Quantification of relative protein levels of mural cell differentiation markers via immunostaining analysis in HBVPs after 24 hours of laminar or pulsatile flow—(D) platelet-derived growth factor receptor beta (PDGFRB) (p = 0.0001, uncorrected Fisher’s LSD; N = 3); (E) alpha-smooth muscle actin (ACTA2) (p = 0.0001, uncorrected Fisher’s LSD; N = 5); and (F) Transgelin (TAGLN) (p = 0.0001, uncorrected Fisher’s LSD; N = 3). G) Representative images of PDGFRB, ACTA2, and TAGLN immunostaining following HBVP-GFP exposure to different flow types for 24 hours. GFP-HBVPs are shown in grey. scale bar = 50 μm. H-J) qPCR transcript levels in HAoSMCs of mural cell differentiation markers after 24 hours of laminar or pulsatile flow—(H) platelet-derived growth factor receptor beta PDGFRB (p = 0.1008, uncorrected Fisher’s LSD; N = 3); (I) alpha-smooth muscle actin (ACTA2) (p = 0.3115, uncorrected Fisher’s LSD; N = 5); and (J) Transgelin (TAGLN) (p = 0.7275 uncorrected Fisher’s LSD; N = 3). All data is normalized to GAPDH. K-M) Quantification of relative protein levels of mural cell differentiation markers via immunostaining analysis in HAoSMCs after 24 hours of laminar or pulsatile flow—(K) PDGFRB (p = 0.0035, unpaired two-tailed t-test; N = 3); (L) ACTA2 (p = 0.3463, unpaired two-tailed t-test t; N = 5); and (M) TAGLN (p = 0.6838, unpaired two-tailed t-test; N = 3). N) Representative images of PDGFRB (cyan), ACTA2 (magenta), and TAGLN (yellow) immunostaining following HAoSMC exposure to different flow types for 24 hours. Culture nuclei (both ECs and HAoSMCs) are shown in grey. scale bar = 50 μm. |

Inhibition of Piezo1 impairs vSMC association with the dorsal aorta in zebrafish. A) Schematic of a 96 hpf zebrafish embryo and the imaging area collected within the zebrafish for analysis. Confocal images of the medial trunk of Tg(tagln:eGFP; kdrl:mCherry-CAAX) zebrafish treated with 50 nM of GsMTx4 or water as the vehicle control. vSMCs shown in green and the endothelium in magenta. Arrows highlight vSMCs associated with the dorsal aorta. B,C) Quantification of tagln positive vSMCs associated with (B) the dorsal aorta or (C) the cardinal vein following treatment with GsMTx4 (p = 0.0008, unpaired two-tailed t-test; N = 25 and 30). D) Confocal images of the medial trunk of Tg(tagln:eGFP; kdrl:mCherry-CAAX) zebrafish carrying mutations to piezo1 and piezo2a.1. Arrows highlight vSMCs associated with the dorsal aorta. E,F) piezo1+/-;piezo2a.1-/- individuals were crossed to piezo1+/-;piezo2a.1+/- individuals to generate the indicated genotypes. Quantification is shown of tagln positive vSMCs associated with the dorsal aorta (E) or cardinal vein (F) piezo1+/-; piezo2+/- (N = 10); piezo1+/+; piezo2+/- (N = 6); piezo1+/+; piezo2-/- (N = 4); piezo1+/-; piezo2-/- (N = 10); piezo1-/-; piezo2+/- (N = 10). piezo1+/-; piezo2+/- vs. piezo1+/-; piezo2-/- (p = 0.0184), piezo1+/-; piezo2+/- vs. piezo1-/-; piezo2+/- (p = 0.0232). The box plots show the median versus the first and third quartiles of the data. The whiskers indicate the spread of data within 1.5x above and below the interquartile range. Statistics were preformed using one-way ANOVA with uncorrected Fisher’s LSD. piezo1-/-;piezo2a.1-/- double mutants lack robust blood flow and have edema; therefore, they were excluded from the analysis. Data in B was normalized to the control artery condition to allow for collating data from fish across multiple experiments. scale bar = 50 μm. PHENOTYPE:
|
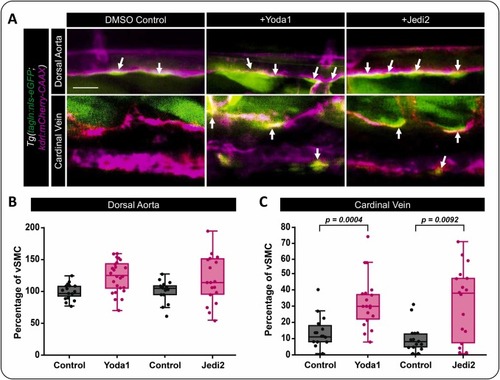
Activation of Piezo1 activity induces vSMC’s association with the cardinal vein. A) Confocal images of the medial trunk of Tg(tagln:eGFP; kdrl:mCherry-CAAX) zebrafish treated with 10 nM of Yoda1, 400 nM of Jedi2 or DMSO as the vehicle control. vSMCs are shown in green and the endothelium in magenta. Arrows highlight vSMCs associated with the dorsal aorta and cardinal vein. B,C) Quantification of tagln positive vSMCs associated with (B) the dorsal aorta or (C) the cardinal vein following treatment with Yoda1, Jedi2, or DMSO (control). DMSO vs Yoda1 (p = 0.0004; N = 21 and 25); DMSO vs Jedi2 (p = 0.0092; N = 15 and 18). Statistical analysis was performed using a Kruskal-Wallis test with Dunn’s multiple comparison test. Data in B and C were normalized to the control artery condition to allow for collating data from fish across multiple experiments. Scale bar = 50 μm. PHENOTYPE:
|
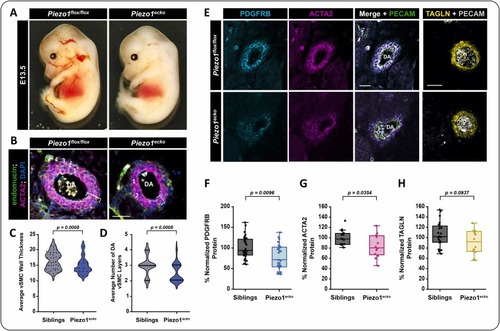
EC-specific Piezo1 knockout reduces vSMC association with the dorsal aorta in mice. A) VE-Cad:Cre mice were crossed to Piezo1flox//flox mice to generate E12.5–13.5 embryos across genotypes. Representative images of a Piezo1flox//flox sibling and an EC-specific Piezo1 deficient embryo (Piezo1ecko) are shown. B) Immunostaining of cross sections of the descending dorsal aorta (DA) in Piezo1flox/flox versus Piezo1ecko E12.5–13.5 embryos. The endothelium is labeled with endomucin in green, vSMCs are labeled with alpha-smooth muscle actin (ACTA2) in magenta, and nuclei (DAPI) are shown in blue. The white bracket indicates the wall thickness of the the vSMC layer, the white numbers indicate the number of vSMC layers present. C) Quantification of the average vSMC wall thickness (um) in Piezo1flox/flox and Piezo1ecko embryos (p = 0.0008, N = 42 siblings; N = 20 Piezo1ecko). Statistical analysis was performed using a two-tail unpaired t-test. D) Quantification of the average number of vMSC layers on the descending DA in Piezo1flox/flox and Piezo1ecko embryos (p = 0.0008, N = 42 siblings; N = 20 Piezo1ecko). Statistical analysis was performed using a two-tail unpaired t-test. Scale bar (B) = 50 μm. E) Immunostaining of cross sections of the descending dorsal aorta (DA) in Piezo1flox/flox versus Piezo1ecko E12.5–13.5 embryos for PDGFRB (cyan), ACTA2 (magenta), and TAGLN (yellow) protein versus PECAM (green or grey depending on panel) to mark the endothelium and budding blood cells. F-H) Quantification of the average immunostaining intensity in vSMCs for; (F) PDGFRB (p = 0.0096, unpaired two-tailed t-test; N = 34 sibling sections; N = 26 Piezo1ecko sections); (G) ACTA2 (p = 0.0354, unpaired two-tailed t-test; N = 16 sibling sections; N = 12 Piezo1ecko sections); and (H) TAGLN (p = 0.0937, unpaired two-tailed t-test; N = 22 sibling sections; N = 12 Piezo1ecko sections). |
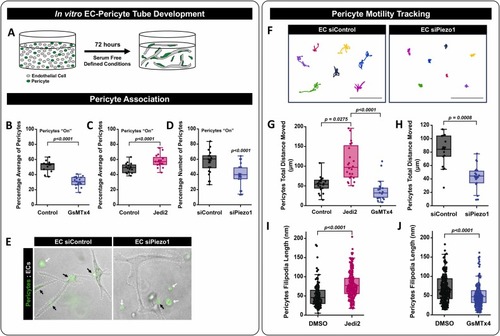
3D in vitro modeling of endothelial cell and pericyte interactions can be regulated by Piezo1 activity. A) Schematic representation of our 3D cell culture model. HUVECs (EC) and GFP-HBVPs (pericyte) were seeded in a 5:1 ratio, respectively, in a 3D collagen type I gel and allowed to self-assemble for 72 hours. Piezo1 activity was modulated pharmacologically by treating the cell cultures with 400 nM Jedi2 or 50 nM of GsMTx4 versus DMSO (control) or by siRNA suppression of EC Piezo1 (siPiezo1) versus an siRNA control (siControl). After 72 hours of incubation, pericyte association with EC tubes was evaluated. B) Quantification of pericyte colocalization with EC tubes under treatments with control (water) and GsMTx4. (p = 0.0001, N = 15 independent cultures). Statistical analysis was performed using a two-tail unpaired t-test. C) Quantification of pericyte colocalization with EC tubes under treatments with control (DMSO) and Jedi2. (p = 0.0001, N = 3–5 independent cultures). Statistical analysis was performed using a two-tail unpaired t-test. D) Quantification of pericyte colocalization with EC tubes following EC specific treatment with Piezo1 siRNA (p = 0.0001, N = 30 independent cultures). Statistical analysis was performed using a two-tail unpaired t-test. E) Representative images of EC/GFP-pericyte cocultures. EC tubes are outlined by the white dashed line, and GFP-pericytes are green in siControl and EC siPiezo1 conditions. F) Representative cell tracking plots of GFP-pericytes in 3D cocultures over 48 hours. G,H) Quantification of GFP-pericyte total motility in 3D cocultures, obtained from 48-hour time-lapse video tracking of cultures treated with (H) Jedi2 (p = 0.00275) or GsMTx4 (N = 12–25 independent cells); or (G) EC siPiezo1 cultures (p = 0.0001, N = 24 independent cells). Statistical analysis was performed using one way ANOVA with a Tukey’s multiple comparison test. I,J) Quantification of GFP-pericyte filipodia length in 3D cocultures (I) DMSO vs Jedi2 (p = 0.0001, N = 200 cells), (J) DMSO vs. GsMTx4 (p = 0.0001, N = 200 cells). Phenotypes were assessed after 72 hours in Jedi2 (I) GsMTx4 (J). Statistical analysis was performed using a two-tail Mann-Whitney test. Scale bar = 50 μm. |