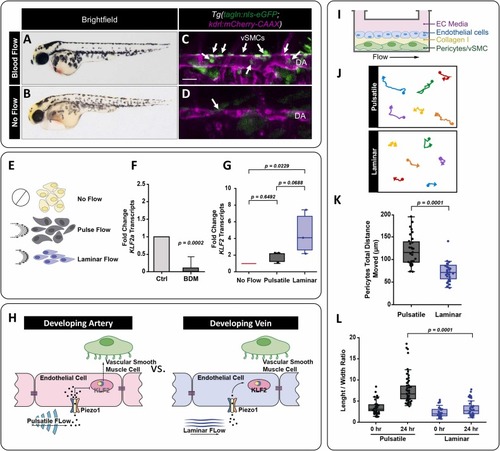
Pulsatile versus continuous laminar flow differentially regulates klf2 expression and mural cell behavior. A,B) 4 dpf zebrafish embryo with normal blood flow (A) compared to a sibling zebrafish treated with 20 mM of BDM (2,3-butanedione monoxide) at 48 hours to stop the blood flow (B). C,D) Confocal image of the medial trunk of a 4 dpf Tg(tagln:nls-eGFP; kdrl:mCherry-CAAX) zebrafish with normal blood flow (C) versus those treated with BDM (D). The endothelium is pseudo colored magenta, and tagln+ smooth muscle cell nuclei are shown in green and identified by the white arrows. DA: dorsal aorta; scale bar = 50 μm. E) Schematic representation of no flow, pulsatile flow, and laminar flow conditions. The arrows indicate the direction of flow at a given time, and the schematics the relative orientation of the cells to the direction of flow. F) qPCR analysis of klf2a transcript levels in 48 hpf zebrafish embryos with and without blood flow. The data is normalized to the ‘with blood flow’ control condition. (p = 0.0002, N = 3 experiments). G) KLF2 transcript levels in HUVECs exposed to pulsatile or continuous laminar flow normalized to the no flow condition. Expression of KLF2 in the laminar flow condition was statistically significant compared with the no flow control; (p = 0.0229, N = 3 experiments). Statistics were analyzed using the nonparametric Kruskal-Wallis test with Dunn’s multiple comparison test. H) The schematic representation shows the proposed relationship between blood flow types, mechanical forces, and different patterns of vSMC association that occur between arteries and veins. We hypothesize that Piezo1 is the mechanosensor responsible for sensing hemodynamic forces, playing a role in vSMC association and differentiation. I) Schematic representation of the experimental setup for the endothelial cells and pericytes flow co-culture studies. J) Representative tracking of HBVP-GFP movements under laminar versus pulsatile flow. The filled circle marks the start of the track and the arrowhead at the end. K) Quantification of HBVP-GFP total movement under pulsatile (N = 38) or continuous laminar (N = 33) flow. Unpaired t-test (p = 0.0001). L) Average HBVP-GFP length-to-width aspect ratios at 0 hours or after 24 hours under pulsatile versus laminar flow. Statistical analysis was performed using Kruskal-Wallis test with Dunn’s multiple comparison test (p = 0.0001, N = 63).
|
