|
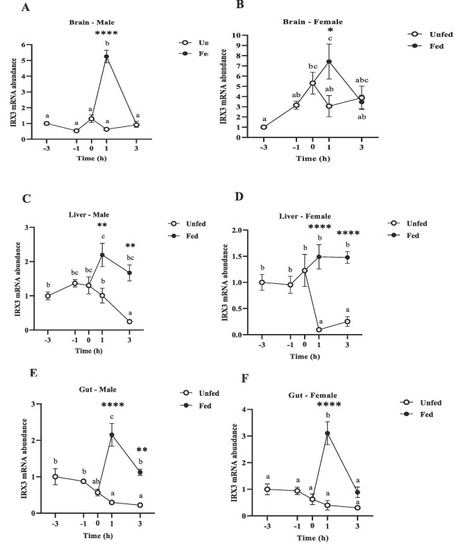
Preprandial and postprandial changes in IRX3 mRNA abundance in the metabolic tissues in male and female zebrafish brain (A, B), liver (C, D) and gut (E, F). Samples were collected before scheduled feeding time (− 3 h and − 1 h), at feeding time (0 h), and after scheduled feeding time (+ 1 h and + 3 h) in both fed and unfed fish. IRX3 mRNA expression was normalized to β-actin and 18S and represented relative to the expression in the -3h group. Different letters indicate significant differences (p < 0.05) among the different time points in fed (black dots) or unfed (white dots) groups, Data are expressed as mean ± SEM (n = 6 zebrafish/group) relative to the lowest average expression. Asterisks indicate significant differences (*p < 0.05, **p < 0.01, ***p < 0.001 ****p < 0.0001) between groups at the same time point.
|