
Fig. 4
- ID
- ZDB-FIG-250120-48
- Publication
- Karimzadeh et al., 2024 - Fat mass and obesity associated gene and homeobox transcription factor iriquois-3 mRNA profiles in the metabolic tissues of zebrafish are modulated by feeding and food deprivation
- Other Figures
- All Figure Page
- Back to All Figure Page
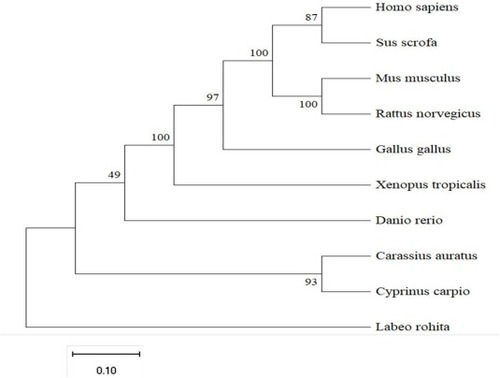
Phylogenetic analysis of IRX3 amino acid sequences. A phylogenetic tree based on the amino acid sequences of IRX3 was constructed by MEGA 11 program using the Neighbor-Joining method. The number at each node indicates the bootstrap value obtained for 1000 replicates. The scale bar shows genetic distance. GenBank accession numbers: Homo sapiens IRX3 (NP_001382062.1), Mus musculus IRX3(NP_001240751.1), Rattus norvegicus IRX3 (NP_001382062.1), Sus scrofa IRX3 (XP_003127029.3) Xenopus tropicalis IRX3(AAH67972.1), Gallus gallus IRX3 (XP_040536955.1), Danio rerio IRX3 (NP_001307054.1), Carassius auratus IRX3 (XP_026123362.1) Cyprinus carpio IRX3 (XP_042583802.1), Labeo rohita IRX3 (XP_050969709.1). |