
- Title
-
Fat mass and obesity associated gene and homeobox transcription factor iriquois-3 mRNA profiles in the metabolic tissues of zebrafish are modulated by feeding and food deprivation
- Authors
- Karimzadeh, K., Uju, C., Zahmatkesh, A., Unniappan, S.
- Source
- Full text @ Gen. Comp. Endocrinol.
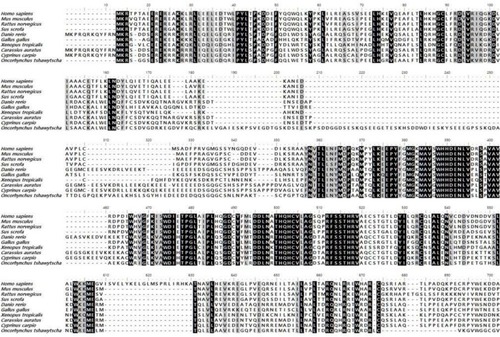
Multiple sequence alignment of FTO from different species and isoforms. Multiple sequence alignments were conducted using Clustal Omega (www.ebi.ac.uk). The name of the species is given on the left side of the alignment and the number of amino acids in the peptide is provided above the alignment. The black background indicates conserved amino acid residues, and the gray background indicates similar amino acid residues. Species names and GenBank (www.ncbi.nim.nih.gov) accession numbers used in the alignment are as follows; Homo sapiens FTO (NP_001073901.1), Mus musculus FTO (NP_036066), Rattus norvegicus FTO (XP_038953492.1), Sus scrofa FTO (NP_001106162.1) Xenopus tropicalis FTO(NP_001017273.1), Gallus gallus FTO (NP_001172076.1), Danio rerio FTO (XP_001345910.4), Carassius auratus FTO (XP_026123363.1) Cyprinus carpio FTO(XP_042583804.1), Oncorhynchus tshawytscha FTO(XP_042186975.1). |
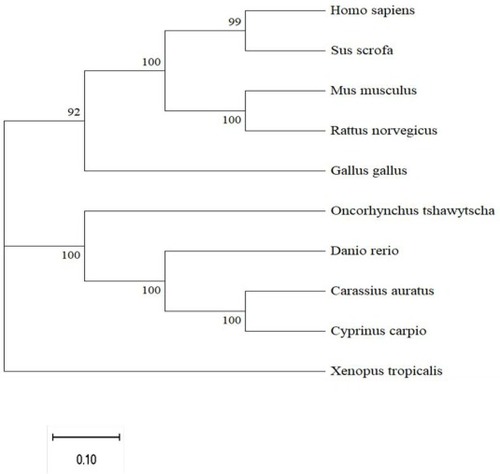
Phylogenetic analysis of FTO amino acid sequences. A phylogenetic tree based on the amino acid sequences of FTO was constructed by MEGA 11 program using the Neighbor-Joining method. The number at each node indicates the bootstrap value obtained for 1000 replicates. The scale bar shows genetic distance. GenBank accession numbers: Homo sapiens FTO (NP_001073901.1), Mus musculus FTO (NP_036066), Rattus norvegicus FTO (XP_038953492.1), Sus scrofa FTO(NP_001106162.1) Xenopus tropicalis FTO(NP_001017273.1), Gallus gallus FTO(NP_001172076.1), Danio rerio FTO (XP_001345910.4), Carassius auratus FTO (XP_026123363.1) Cyprinus carpio FTO(XP_042583804.1), Oncorhynchus tshawytscha FTO(XP_042186975.1). |
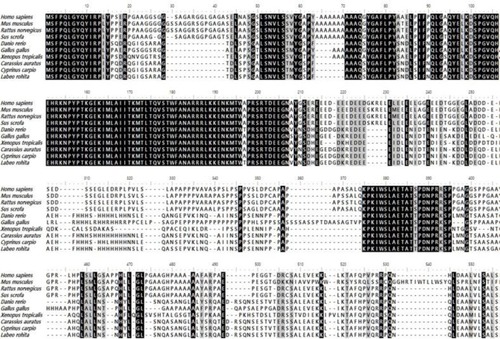
Multiple sequence alignment of IRX3 from different species. Multiple sequence alignments were conducted using Clustal Omega (www.ebi.ac.uk). The name of the species is given on the left side of the alignment and the number of amino acids in the peptide is provided above the alignment. The black background indicates conserved amino acid residues, and the dark gray background indicates similar amino acid residues. Species names and GenBank (www.ncbi.nim.nih.gov) Accession Numbers identification numbers used in the alignment are as follows; Homo sapiens IRX3 (NP_001382062.1), Mus musculus IRX3(NP_001240751.1), Rattus norvegicus IRX3 (NP_001382062.1), Sus scrofa IRX3 (XP_003127029.3) Xenopus tropicalis IRX3(AAH67972.1), Gallus gallus IRX3 (XP_040536955.1), Danio rerio IRX3 (NP_001307054.1), Carassius auratus IRX3 (XP_026123362.1) Cyprinus carpio IRX3 (XP_042583802.1), Labeo rohita IRX3 (XP_050969709.1). |
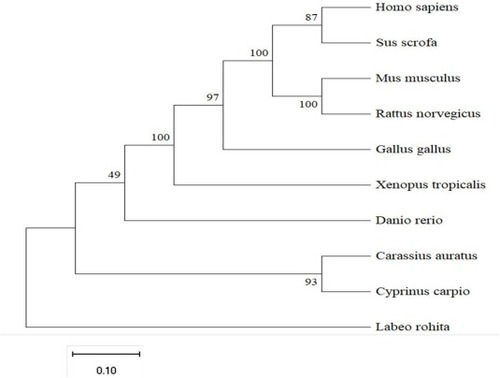
Phylogenetic analysis of IRX3 amino acid sequences. A phylogenetic tree based on the amino acid sequences of IRX3 was constructed by MEGA 11 program using the Neighbor-Joining method. The number at each node indicates the bootstrap value obtained for 1000 replicates. The scale bar shows genetic distance. GenBank accession numbers: Homo sapiens IRX3 (NP_001382062.1), Mus musculus IRX3(NP_001240751.1), Rattus norvegicus IRX3 (NP_001382062.1), Sus scrofa IRX3 (XP_003127029.3) Xenopus tropicalis IRX3(AAH67972.1), Gallus gallus IRX3 (XP_040536955.1), Danio rerio IRX3 (NP_001307054.1), Carassius auratus IRX3 (XP_026123362.1) Cyprinus carpio IRX3 (XP_042583802.1), Labeo rohita IRX3 (XP_050969709.1). |
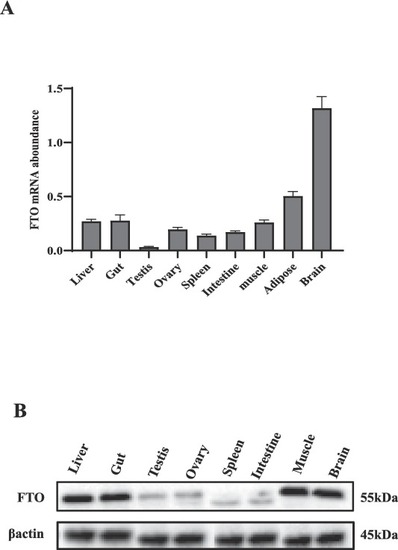
Tissue distribution of FTO. (A) FTO mRNA abundance in different tissues. (B) Western blot analysis of FTO protein in different tissues. The amount of FTO mRNA abundance was normalized to the amount of β-actin. Bars present the mean ± SEM (n = 6 zebrafish). |
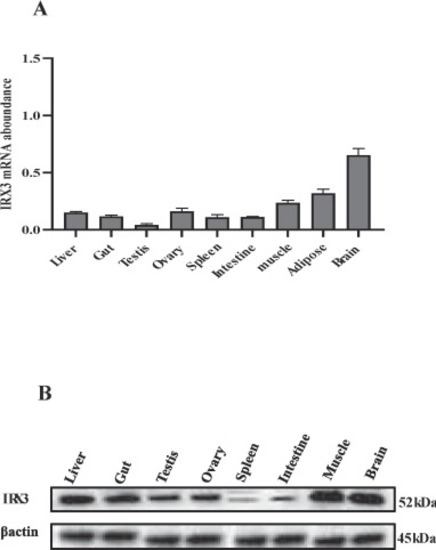
Tissue distribution of IRX3. (A) IRX3 mRNA abundance in different tissues. (B) Western blot analysis of IRX3 protein levels in different tissues. The amount of IRX3 mRNA abundance was normalized to the amount of β-actin. Bars present the mean ± SEM (n = 6 zebrafish). |
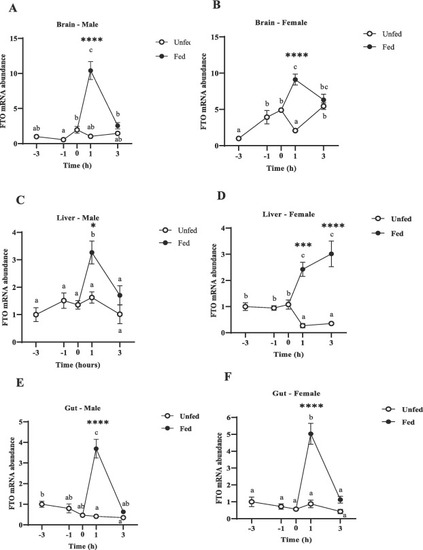
Preprandial and postprandial changes in FTO mRNA abundance in the metabolic tissues in male and female zebrafish brain (A, B), liver (C, D) and gut (E, F). Samples were collected before scheduled feeding time (− 3 h and − 1 h), at feeding time (0 h), and after scheduled feeding time (+ 1 h and + 3 h) in both fed and unfed fish. FTO mRNA expression was normalized to β-actin and 18S and data are presented as a fold of the expression in the -3h group. Different letters indicate significant differences (p < 0.05) among the different time points in fed (black dots) or unfed (white dots) groups, Data are expressed as mean ± SEM (n = 6 zebrafish/group) relative to the lowest average expression. Asterisks indicate significant differences (*p < 0.05, **p < 0.01, ***p < 0.001 ****p < 0.0001) between groups at the same time point. |
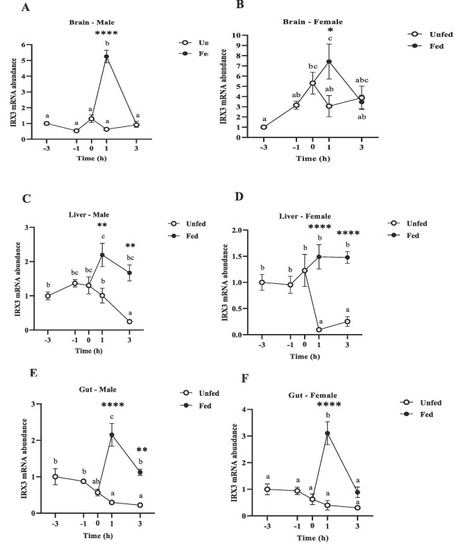
Preprandial and postprandial changes in IRX3 mRNA abundance in the metabolic tissues in male and female zebrafish brain (A, B), liver (C, D) and gut (E, F). Samples were collected before scheduled feeding time (− 3 h and − 1 h), at feeding time (0 h), and after scheduled feeding time (+ 1 h and + 3 h) in both fed and unfed fish. IRX3 mRNA expression was normalized to β-actin and 18S and represented relative to the expression in the -3h group. Different letters indicate significant differences (p < 0.05) among the different time points in fed (black dots) or unfed (white dots) groups, Data are expressed as mean ± SEM (n = 6 zebrafish/group) relative to the lowest average expression. Asterisks indicate significant differences (*p < 0.05, **p < 0.01, ***p < 0.001 ****p < 0.0001) between groups at the same time point. |
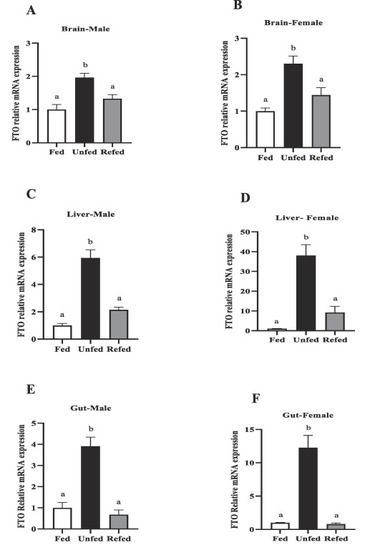
FTO mRNA abundance in the metabolic tissues of male and female zebrafish during 7-day food deprivation and 24 h post-feeding (refed group). Brain (A–B), liver (C–D( and gut (E,F). FTO mRNA expression was normalized to β-actin and 18S. Different letters above bars indicate significant differences between groups (one-way ANOVA followed by Student-Newman-Keul’s post-hoc test, P < 0.05). Asterisks represent significant differences among the groups at the same time point (Student’s t-test; (*p < 0.05, **p < 0.01, ***p < 0.001 ****p < 0.0001). Data are expressed as mean ± SEM (n = 6 zebrafish/group). |
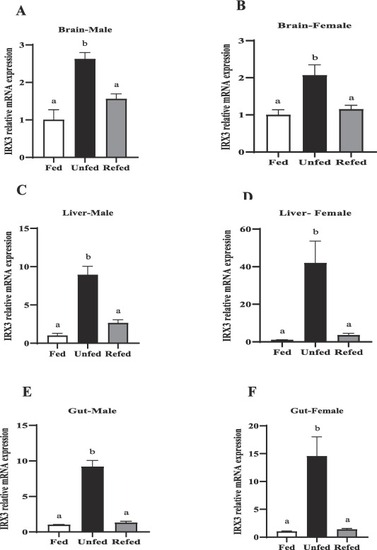
IRX3 mRNA abundance in the metabolic tissues of male and female zebrafish during 7-day fasting, and 24 h post-feeding (refed group). Brain (A–B), liver (C–D) and gut (E,F). FTO mRNA expression was normalized to β-actin and 18S. Different letters above bars indicate significant differences between groups (one-way ANOVA followed by Student-Newman-Keul’s post-hoc test, P < 0.05). Asterisks represent significant differences among the groups at the same time point (Student’s t-test; (*p < 0.05, **p < 0.01, ***p < 0.001 ****p < 0.0001). Data are expressed as mean ± SEM (n = 6 zebrafish/group). |