FIGURE

Figure 1

ID
ZDB-FIG-250110-141
Publication
Men et al., 2024 - DEHP-Induced Glioblastoma in Zebrafish Is Associated with Circadian Dysregulation of PER3
Other Figures
All Figure Page
Back to All Figure Page
Figure 1

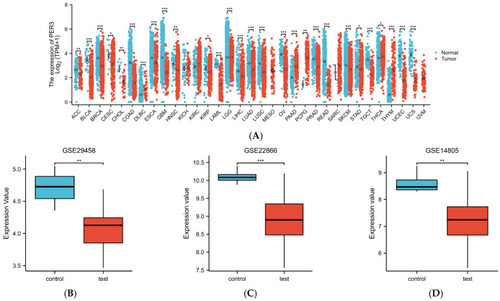
PER3 expression is significantly downregulated in several cancers, including GBM. (A) TCGA database analysis showed the expression levels of PER3 in 33 cancer tissues and their corresponding surrounding normal tissues. * p < 0.05; ** p < 0.01; *** p < 0.001. (BD) The expression levels of PER3 in cases (B) GSE29458, (C) GSE22866, and (D) GSE14805 in GBM tissues had significantly higher expression levels than normal brain tissues. (E,F) The 706 GBM patients in the TCGA-GBMLGG database were categorized into high-expression and low-expression groups based on the median PER3 expression level. (E) Volcano plot and (F) heat map demonstrating the expression levels of specific mRNAs in GBM patients.

Expression Data

Expression Detail
Antibody Labeling
Phenotype Data

Phenotype Detail
Acknowledgments
This image is the copyrighted work of the attributed author or publisher, and ZFIN has permission only to display this image to its users. Additional permissions should be obtained from the applicable author or publisher of the image. Full text @ Toxics