
FIGURE
Figure 6
Figure 6
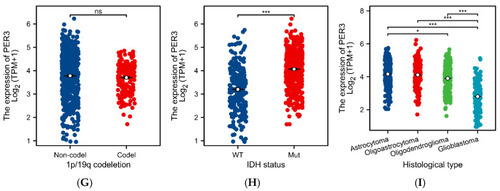
PER3 expression levels correlate with a variety of clinical case characteristics in GBM patients. ( |
Expression Data
Expression Detail
Antibody Labeling
Phenotype Data
Phenotype Detail
Acknowledgments
This image is the copyrighted work of the attributed author or publisher, and
ZFIN has permission only to display this image to its users.
Additional permissions should be obtained from the applicable author or publisher of the image.
Full text @ Toxics