FIGURE

Figure 3

ID
ZDB-FIG-250110-145
Publication
Men et al., 2024 - DEHP-Induced Glioblastoma in Zebrafish Is Associated with Circadian Dysregulation of PER3
Other Figures
All Figure Page
Back to All Figure Page
Figure 3

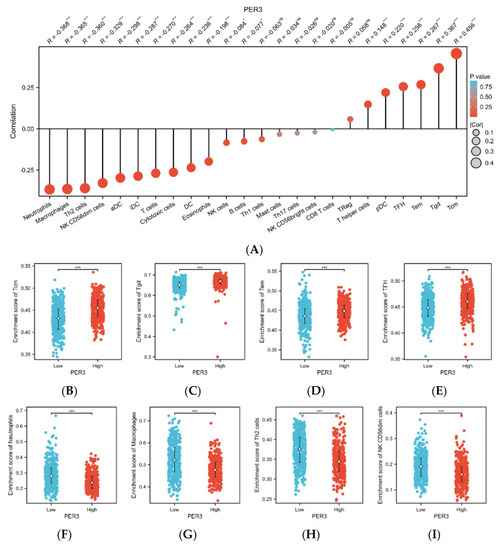
Correlation analysis of immune cell infiltration with PER3 expression in GBM. (A) Spearman’s correlation analysis of the infiltration level of 24 immune cells with the expression level of PER3 in GBM tissues. (BI) Infiltration levels of (B) central memory cells, (C) γδ T cells, (D) effector memory T cells, (E) follicular helper T cells, (F) neutrophils, (G) macrophages, (H) type 2 helper T cells, and (I) CD56dim NK cells in the high and low expression groups. ns, p ≥ 0.05; * p < 0.05; *** p < 0.001.

Expression Data

Expression Detail
Antibody Labeling
Phenotype Data

Phenotype Detail
Acknowledgments
This image is the copyrighted work of the attributed author or publisher, and ZFIN has permission only to display this image to its users. Additional permissions should be obtained from the applicable author or publisher of the image. Full text @ Toxics