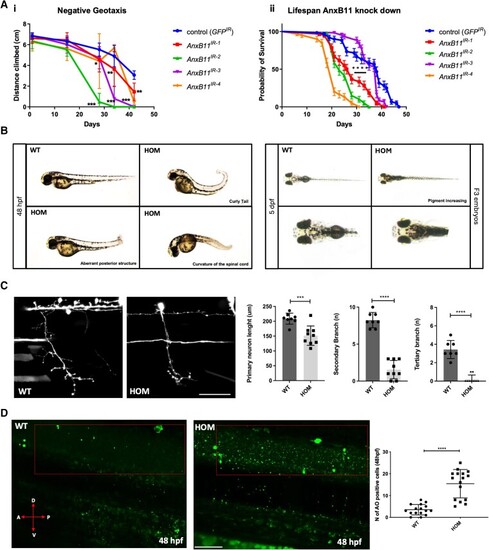
Loss of Annexin A11 function in Drosophila and zebrafish result in behavioural and neuronal phenotypes. [A(i)] Knockdown of Drosophila AnxB11 with four siRNAs [KK101313 (IR-1), GD36186 (IR-2), GD36185 (IR-3) and GD29693 (IR-4)] and a control RNAi against GFP specifically in glutamatergic neurons, including motor neurons in the fly, with the OK371-Gal4 driver identified a time-dependent climbing phenotype after 28 days under all treatments. Two-way ANOVA, Sidak’s multiple comparison for each age *P ≤ 0.05, **P ≤ 0.01, ***P ≤ 0.001. [A(ii)] When driven in all adult neurons with the Elav-Gal4 driver and the temperature-dependent repressor Ubi-Gal80ts three out of four AnxB11 knock down determined a significant shortening in fly lifespan with respect to control flies). Kaplan-Meyer Log Rank test ****P ≤ 0.0001. (B) CRISPR-Cas9 knockout of zebrafish Annexin A11a results in a low penetrant, pleiotropic phenotype observed in ∼30% of F3 homozygous larvae characterized by spinal defects (left), with ∼20% of larvae showing an increase of skin pigment at 5 dpf (days post-fertilization) implicating ocular defects (right). (C) Loss of function leads to abnormalities in axonal length and branching via live imaging of caudal primary (CaP) motor neurons in wild-type (WT) and homozygous (HOM) larvae of primary, secondary and tertiary branches at 48 hpf (hours post-fertilization). Quantitative analysis of axonal length of primary, secondary and tertiary branches after microinjection of eGFP empty vector in WT and HOM identifies significant loss of branching, post hoc Tukey’s multiple comparisons test; axon length ***P ≤ 0.005, secondary and tertiary branches ****P ≤ 0.0001. n = 8 WT, n = 9 hom. Scale bar = 100 μm. (D) Acridine orange (AO) staining of 48 hpf larvae shows a significant increase in apoptotic cells (green). WT and HOM panels showing lateral view and red boxed region of spinal cord for quantification of apoptotic cells. Quantification of number of AO-positive cells in WT and HOM larvae. Expression and cell count data were similar in each replicate (19 cells ± 1.117, 24 hpf; 15 cells ± 1.734 48 hpf) compared to WT siblings (14 cells ±1.117, **P ≤ 0.005 24 hpf; 4 ± 1.734 ****P ≤ 0.0001, 48 hpf; unpaired t-test). Scale bar = 50 μm.
|
