FIGURE SUMMARY
Title

Annexin A11 mutations are associated with nuclear envelope dysfunction in vivo and in human tissue

Authors
Marchica, V., Biasetti, L., Barnard, J., Li, S., Nikolaou, N., Frosch, M.P., Lucente, D.E., Eldaief, M., King, A., Fanto, M., Troakes, C., Houart, C., Smith, B.N.
Source
Full text @ Brain

Loss of Annexin A11 function in Drosophila and zebrafish result in behavioural and neuronal phenotypes. [A(i)] Knockdown of Drosophila AnxB11 with four siRNAs [KK101313 (IR-1), GD36186 (IR-2), GD36185 (IR-3) and GD29693 (IR-4)] and a control RNAi against GFP specifically in glutamatergic neurons, including motor neurons in the fly, with the OK371-Gal4 driver identified a time-dependent climbing phenotype after 28 days under all treatments. Two-way ANOVA, Sidak’s multiple comparison for each age *P ≤ 0.05, **P ≤ 0.01, ***P ≤ 0.001. [A(ii)] When driven in all adult neurons with the Elav-Gal4 driver and the temperature-dependent repressor Ubi-Gal80ts three out of four AnxB11 knock down determined a significant shortening in fly lifespan with respect to control flies). Kaplan-Meyer Log Rank test ****P ≤ 0.0001. (B) CRISPR-Cas9 knockout of zebrafish Annexin A11a results in a low penetrant, pleiotropic phenotype observed in ∼30% of F3 homozygous larvae characterized by spinal defects (left), with ∼20% of larvae showing an increase of skin pigment at 5 dpf (days post-fertilization) implicating ocular defects (right). (C) Loss of function leads to abnormalities in axonal length and branching via live imaging of caudal primary (CaP) motor neurons in wild-type (WT) and homozygous (HOM) larvae of primary, secondary and tertiary branches at 48 hpf (hours post-fertilization). Quantitative analysis of axonal length of primary, secondary and tertiary branches after microinjection of eGFP empty vector in WT and HOM identifies significant loss of branching, post hoc Tukey’s multiple comparisons test; axon length ***P ≤ 0.005, secondary and tertiary branches ****P ≤ 0.0001. n = 8 WT, n = 9 hom. Scale bar = 100 μm. (D) Acridine orange (AO) staining of 48 hpf larvae shows a significant increase in apoptotic cells (green). WT and HOM panels showing lateral view and red boxed region of spinal cord for quantification of apoptotic cells. Quantification of number of AO-positive cells in WT and HOM larvae. Expression and cell count data were similar in each replicate (19 cells ± 1.117, 24 hpf; 15 cells ± 1.734 48 hpf) compared to WT siblings (14 cells ±1.117, **P ≤ 0.005 24 hpf; 4 ± 1.734 ****P ≤ 0.0001, 48 hpf; unpaired t-test). Scale bar = 50 μm.

Loss of function of Annexin11a results in defects of zebrafish neuromuscular junctions. (A) Fixed wild-type (WT) and homozygous (HOM) larvae were stained to label pre and postsynaptic junctions with ZNP1 (blue), αBTX (red) and merge respectively with representative images shown. HOM larvae [(iv–vi), n = 9 embryos] show a loss of branching reflected by a loss of Znp1/Btx co-localization compared to WT [A(i–iii) (n = 8 embryos) and in B]. This was significant on quantification (C) (Pearson’s r coefficients of co-localization, P ≤ 0.0001). Injection with human WT Annexin A11 mRNA had no detrimental effect on the WT larvae [A(vii–ix) (n = 8 embryos)]. Homozygous embryos injected with human WT Annexin A11 (n = 9 embryos) rescued the loss of ZNP1 and αBTX co-localization [A(x–xii)] that was significant (C, unpaired t-test; ****P ≤ 0.0001). Max projections, ×40 oil objective. Scale bar = 100μm. hpf = hours post-fertilization.

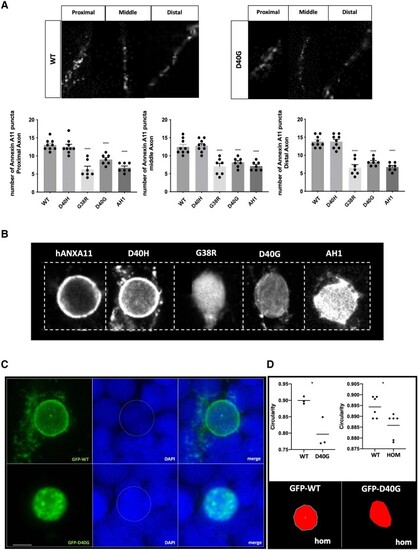
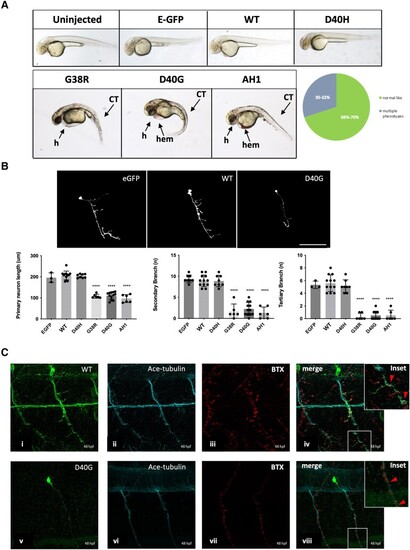
Misexpression of p.D40G, p.G38R and AH1-Annexin A11 in AB Zebrafish result in severe morphological defects at 48 hpf. (A) Lateral view of AB larvae injected at the one-cell stage expressing MNX1:GAL4 and a mix of either empty-UAS GFP, or human Annexin A11-GFP plasmids of wild-type (WT), the non-disease control D40H and mutants D40G, G38R and AH1 (alpha helical 1 deletion) and imaged at 48 hours post-fertilization (hpf). Approximately 30% of larvae with G38R, D40G and AH1 mutants showed a range of morphological phenotypes i.e. curly tail (CT), haemorrhage (hem) and heart defects (h) (n = 40 each group, n = 12 G38R, D40G and AH1 deformed embryos each time, four biological replicates). (B) Live imaging of caudal primary (CaP) motor neurons from normal like GFP positive (+ve) larvae (free of morphological abnormalities) showing representative images (left to right) injected with empty vector-eGFP, wild-type Annexin A11-eGFP and D40G-Annexin A11-eGFP. Neurons imaged from sagittal and cross-sectional view show a single neuron innvervated by a cap neuron (top). Quantitative analysis of axonal length and branching after microinjection with control eGFP vector, wild-type Annexin A11 and amyotrophic lateral sclerosis (ALS) and AH1 mutants (bottom). Statistical analysis was performed on GraphPad Prism 7 using a one-way ANOVA with a post hoc Tukey’s multiple comparisons test. ****P ≤ 0.0001, n = 3: eGFP: n = 12 WT-Annexin A11-eGFP, n = 12: D40G- n = 6 G38R and n = 6 AH1 Annexin A11-eGFP (one axon per biological replicate, maximum projection). Scale bar = 100μm. (C) The D40G mutation results in a reduced amount of axonal Annexin A11 expression and clustering with acetylcholine receptors. [C(i–viii)] Confocal images of zebrafish trunk, lateral view, anterior to the right, imaged at 48 hours post-fertilization (hpf) after microinjection with WT-Annexin A11-eGFP and D40G-Annexin A11-eGFP mutant plasmids and followed by GFP [C(i and v)], ac-Tubulin [C(ii and vi, cyan)] and staining BTX [C(iii and vii, red)]. GFP immunohistochemistry (IHC) demonstrates decreased or absent branching of motor axons in D40G injected embryos, compared to embryos injected with WT-Annexin A11. Insets on [C(iv and viii)] represent effects on postsynaptic development (red arrows and white square). Max projections. Scale bar = 100μm. eGFP = enhanced green fluorescent protein.

WT-Annexin A11 is present as puncta throughout the axon and is reduced due to ALS or AH1 del mutations. (A) Representative single plane images of wild-type (WT) and D40G Annexin A11 positive puncta in the proximal, middle and distal axon segment (top). Puncta were quantified in axons from larvae injected with controls WT Annexin A11, D40H and mutants D40G, G38R and AH1 del. Total n caudal primary (CaP) neurons = 39 (one per embryos): WT-Annexin A11-eGFP (n = 9), D40H-Annexin A11-eGFP (n = 9), G38R-Annexin A11-eGFP (n = 7), D40G-Annexin A11-eGFP (n = 7) and AH1-Annexin A11-eGFP (n = 7) (bottom). All three mutations reduce the amount of Annexin A11 puncta in each segment. ****P ≤ 0.0001, one-way ANOVA, Tukey’s multiple comparison test. (B) Annexin A11 mutations alter Annexin A11 nuclear envelope distribution. Qualitative GFP immunofluorescence shown left to right, wild-type, D40H, G38R, D40G and AH1del-Annexin A11-eGFP and counterstained with DAPI (signal not shown). Images are ×63 and ×3 digital zoom (Zeiss LSM 800). (C) Misexpression of human WT Annexin A11 can rescue nuclear envelope integrity in homozygous Annexin A11a knockout larvae. Top (left to right): Wild-type Annexin A11-eGFP when expressing in knockout Annexin A11a larvae localizes to the nuclear envelope and as perinuclear puncta (eGFP and DAPI merge). Bottom (left to right): D40G Annexin A11-eGFP by contrast is completely nucleoplasmic with the presence of intra-nuclear aggregates (eGFP and DAPI merge). Scale bar = 5 μm. (D) Nuclear circularity changes are associated with loss of Annexin A11a or the D40G mutation in Annexin A11. Bottom: Representative images from circularity analysis of homozygous knockout larvae expressing wild-type or D40G Annexin A11-GFP. Quantification (top left) shows a significant deviation from circularity. *P ≤ 0.05, unpaired t-test wild-type (n = 3) and D40G (n = 3). Similarly, F3 homozygous knockout larvae (top right) show a deviation of nuclear circularity from F3 wild-type larvae of the same line, unpaired t-test *P ≤ 0.05 [WT (n = 6) and homozygous (Hom, n = 6)]. ALS = amyotrophic lateral sclerosis; GFP = green fluorescent protein.

Lamin B2 localization shifts from the nuclear envelope to the nucleoplasm in Annexin A11a homozygous larvae at 48hpf and post-mortem tissue from patients with Annexin A11 mutations. (A) Top: Endogenous Lamin B2 (green) in wild-type (WT) Annexin A11a larvae is localized to the nuclear envelope (and in merge). Large nucleoli are indicated by white arrows (DAPI). Bottom: In Annexin A11a homozygous knockout larvae a pool of Lamin B2 shifts to the nucleoplasm (green and DAPI merge) with a loss of large nucleoli (DAPI). (n = 3) Scale bar = 20 uM. (B) Brightfield Lamin B2 staining of individual anterior horn neurons revealing preserved nuclear membrane staining in the control (CTL) and sporadic ALS (SALS) cases, but diffuse nuclear staining in the G38R and D40G Annexin A11 mutation cases. Scale bar = 50 µm. (C) Violin plot quantifying the mean ratio of the number of neurons containing abnormal nucleoplasmic LMNB2 compared to total number of neuronal nuclei per field (×40 magnification). This included controls (n = 9), G38R, D40G, R191Q (n = 4) non-disease polymorphism, with a minor allele frequency (MAF) of 4.7% in Europeans, R235Q, SALS (n = 5), FUS positive cases (n = 6) and cases with the C9ORF72 GGGGCC expansion (n = 2). Only the G38R and D40G cases showed a significant association with nucleoplasmic LMNB2 (G38R versus Controls, ****P ≤ 0.0001; D40G versus Controls, ***P ≤ 0.005; Kruskal-Wallis test for multiple comparisons). (D) Western blot Lamin B2 expression of post-mortem motor cortex tissue from an Annexin A11 D40G patient (n = 3) and control cases (n = 7) compared to GAPDH expression. (E) Quantification of Lamin B2 expression in D40G tissue is ∼1.8-fold higher compared to controls (****P ≤ 0.0001, unpaired t-test). dpf = days post-fertilization; Hom = homozygous.

Immunostaining of Lamin B2 and Annexin A11 in controls and Annexin A11 mutant ALS+/FTD cases. (A) Immunostaining of LMNB2 in a representative control and spinal cord (SC) of anterior horn neurons from the G38R case. Tissue was stained for LMNB2, ChAT (choline acetyltransferase) to label motor neurons and DAPI. A representative ChAT positive motor neuron [A(ii)] displaying a nuclear envelope localized LMNB2 signal [A(ii and iii)]. Two ChAT positive motor neurons [A(v and viii)] from the G38R case showing abnormal nucleoplasmic LMNB2 [A(iv, vi and vii, ix), respectively]. Images presented as 3D z-stack projections. Scale bar = 50 µm. (B) Immunostaining of a representative control and spinal cord of anterior horn neurons from the G38R case displaying the difference in Annexin signal. Wild-type ring-like LMNB2 [B(i), red arrow] and cytoplasmic diffuse Annexin signal [B(ii), green arrow] in a representative control neuron [B(iii)]. Images presented as 3D z-stack projections. Single plane image from the anterior horn region of spinal cord tissue from the G38R case [B(iv)]. Neurite aggregates of Annexin can be seen (green arrows). Representative image of neurons reiterating the LMNB2 nucleoplasmic signal [B(vi and vii, red arrow)] and displaying a more punctate Annexin signal [B(vi and vii, green arrows)]. Images presented as 3D z-stack projections. Scale bar = 50 µm. (C) Immunostaining of a representative control and motor cortex neurons from the G38R case showing a marked presence of Annexin aggregation. Representative control motor cortex neuron displaying a diffuse cytoplasmic Annexin signal [C(i and ii)]. Motor cortex from the G38R case showing nucleoplasimc LMNB2 signal and neuropil Annexin aggregates (green arrows) [C(iii)]. Neurons from the G38R case motor cortex reporting heavy perinuclear Annexin aggregates [C(iv, v and vi, vii), respectively; green arrows for Annexin aggregates, red arrows for LMNB2 nucleoplasmic signal]. Images presented as 3D z-stack projections. Scale bar = 50 µm.

Acknowledgments
This image is the copyrighted work of the attributed author or publisher, and ZFIN has permission only to display this image to its users. Additional permissions should be obtained from the applicable author or publisher of the image. Full text @ Brain