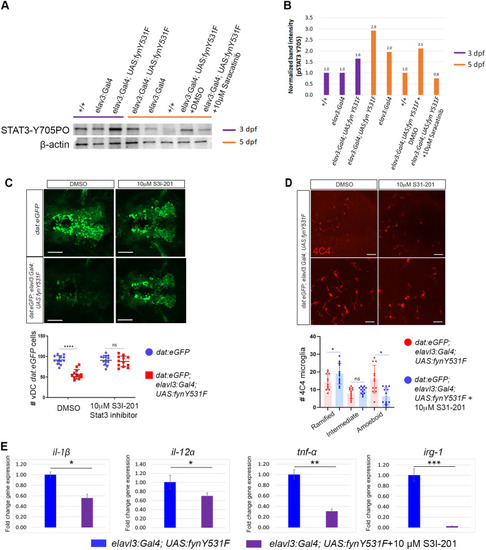
Stat3 inhibition suppresses FynY531F-driven dopaminergic neuron degeneration and induction of il1b, il12a, tnfa and irg1 expression. (A) Western blot of 3 dpf and 5 dpf +/+, control elavl3:Gal4 and elavl3:Gal4; UAS:fynY531F larval extracts probed with anti-Stat3-Y705-PO antibody shows increased Stat3-Y705 phosphorylation in elavl3:Gal4; UAS:fynY531F larvae. elavl3:Gal4; UAS:fynY531F larvae treated from 3 dpf to 5 dpf with 10 µM Saracatinib (Src family inhibitor) show reduced Stat3-Y705 phosphorylation. Blot was probed with anti-Gapdh and anti-β-actin as protein-loading controls. (B) Quantification of band intensities on Stat3-Y750-PO western blot. (C) Top: live confocal imaging of vDC eGFP dopaminergic neurons in 5 dpf control dat:eGFP and dat:eGFP;elav:Gal4; UAS:fynY531F larvae show rescue of dopaminergic neuron loss after treatment with 10 µM S3I-201 (Stat3 inhibitor). Bottom: quantification of vDC eGFP dopaminergic neuron number in 5 dpf control dat:eGFP and dat:eGFP;elav:Gal4; UAS:fynY531F larvae after treatment with 10 µM S3I-201 (n=12). Statistical analysis was performed using two-way ANOVA with Tukey's multiple comparison. (D) Top: confocal imaging of fixed, whole-mount anti-4C4 immunolabeling in brain of 5 dpf control dat:eGFP and dat:eGFP;elav:Gal4; UAS:fynY531F larvae at low magnification (top row) and high magnification (bottom row) after treatment with vehicle (DMSO) and Stat3 inhibitor (S3I-201). Bottom: quantification of 4C4-positive microglia with ramified, intermediate or amoeboid morphology number in 5 dpf control dat:eGFP and dat:eGFP;elav:Gal4; UAS:fynY531F larvae and after treatment with 10 mM Stat3 inhibitor S3I-201 (n=12). Analysis was performed using two-way ANOVA with Tukey's multiple comparison. (E) RT-qPCR of il1b, il12a, tnfa, and irg1 in RNA extracts from untreated and 10 µM S3I-201-treated 5 dpf elavl3:Gal4; UAS:fynY531F larvae (n=3 biological replicates for each genotype). Statistical analysis was performed with two-tailed unpaired Student's t-test. Bars represent mean±s.e.m. ns, not significant; *P<0.05; **P<0.01; ***P<0.001; ****P<0.0001. Scale bars: 100 µm (C); 20 µm (D).
|
