IMAGE

Fig. 6.

ID
ZDB-IMAGE-241218-87
Source
Figures for Siddiqui et al., 2024
Image
Figure Caption

Fig. 6.

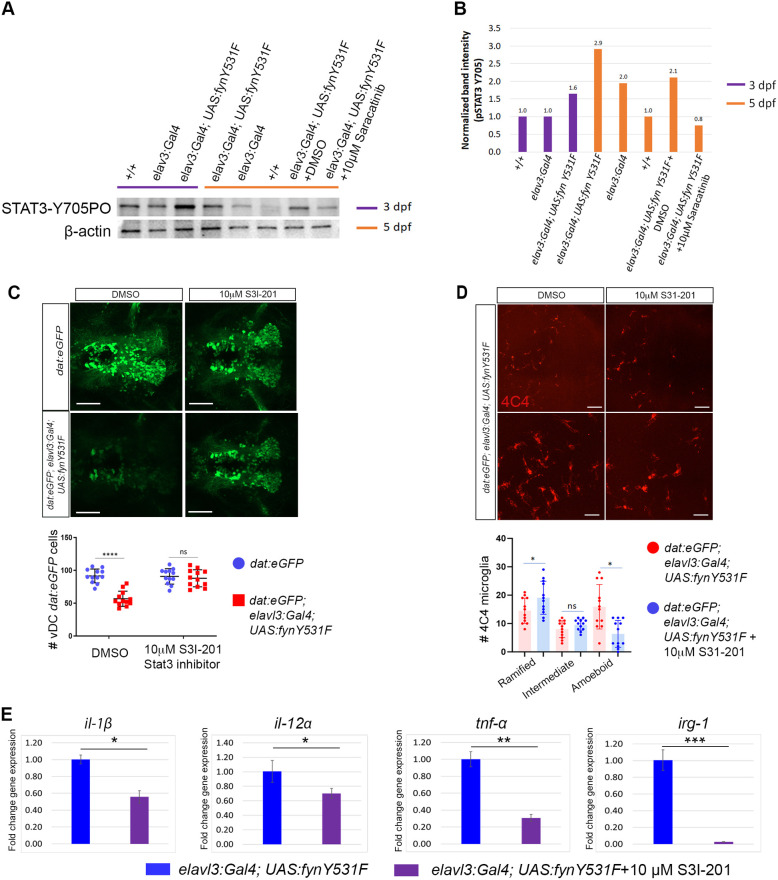
Stat3 inhibition suppresses FynY531F-driven dopaminergic neuron degeneration and induction of il1b, il12a, tnfa and irg1 expression. (A) Western blot of 3 dpf and 5 dpf +/+, control elavl3:Gal4 and elavl3:Gal4; UAS:fynY531F larval extracts probed with anti-Stat3-Y705-PO antibody shows increased Stat3-Y705 phosphorylation in elavl3:Gal4; UAS:fynY531F larvae. elavl3:Gal4; UAS:fynY531F larvae treated from 3 dpf to 5 dpf with 10 µM Saracatinib (Src family inhibitor) show reduced Stat3-Y705 phosphorylation. Blot was probed with anti-Gapdh and anti-β-actin as protein-loading controls. (B) Quantification of band intensities on Stat3-Y750-PO western blot. (C) Top: live confocal imaging of vDC eGFP dopaminergic neurons in 5 dpf control dat:eGFP and dat:eGFP;elav:Gal4; UAS:fynY531F larvae show rescue of dopaminergic neuron loss after treatment with 10 µM S3I-201 (Stat3 inhibitor). Bottom: quantification of vDC eGFP dopaminergic neuron number in 5 dpf control dat:eGFP and dat:eGFP;elav:Gal4; UAS:fynY531F larvae after treatment with 10 µM S3I-201 (n=12). Statistical analysis was performed using two-way ANOVA with Tukey's multiple comparison. (D) Top: confocal imaging of fixed, whole-mount anti-4C4 immunolabeling in brain of 5 dpf control dat:eGFP and dat:eGFP;elav:Gal4; UAS:fynY531F larvae at low magnification (top row) and high magnification (bottom row) after treatment with vehicle (DMSO) and Stat3 inhibitor (S3I-201). Bottom: quantification of 4C4-positive microglia with ramified, intermediate or amoeboid morphology number in 5 dpf control dat:eGFP and dat:eGFP;elav:Gal4; UAS:fynY531F larvae and after treatment with 10 mM Stat3 inhibitor S3I-201 (n=12). Analysis was performed using two-way ANOVA with Tukey's multiple comparison. (E) RT-qPCR of il1b, il12a, tnfa, and irg1 in RNA extracts from untreated and 10 µM S3I-201-treated 5 dpf elavl3:Gal4; UAS:fynY531F larvae (n=3 biological replicates for each genotype). Statistical analysis was performed with two-tailed unpaired Student's t-test. Bars represent mean±s.e.m. ns, not significant; *P<0.05; **P<0.01; ***P<0.001; ****P<0.0001. Scale bars: 100 µm (C); 20 µm (D).

Acknowledgments
This image is the copyrighted work of the attributed author or publisher, and ZFIN has permission only to display this image to its users. Additional permissions should be obtained from the applicable author or publisher of the image. Full text @ Dis. Model. Mech.