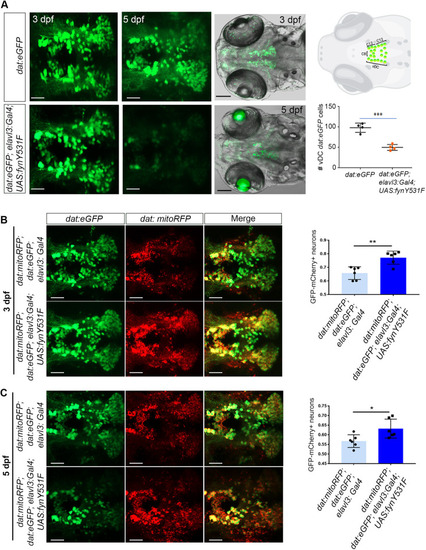
Zebrafish neural FynY531F overexpression drives dopaminergic neuron loss and mitochondria accumulation. (A) Left: live confocal imaging of ventral diencephalon (vDC) neuron cluster eGFP dopaminergic neurons in 3 dpf and 5 dpf control dat:eGFP and elavl3:Gal4; UAS:fynY531F larvae. Top right: vDC in 5 dpf larval brain. Diagram adapted from Kalyn et al. (2019) and created with BioRender.com. Bottom right: quantification of vDC eGFP neuronal cell bodies in 5 dpf control dat:eGFP and dat:eGFP; elavl3:Gal4; UAS:fynY531F larvae (n=4). (B) Left: live confocal imaging of eGFP and mCherry in vDC neurons in 3 dpf control dat:mitoRFP; dat:eGFP; elavl3:Gal4 and dat:mitoRFP; dat:eGFP; elavl3:Gal4; UAS:fynY531F larval brain. Right: quantification of overlap of eGFP and mCherry signal in vDC neuron cell bodies in 3 dpf control dat:mitoRFP; dat:eGFP; elavl3:Gal4 and dat:mitoRFP; dat:eGFP; elavl3:Gal4; UAS:fynY531F larvae (n=6). (C) Left: live confocal imaging of eGFP and mCherry in vDC neurons in 5 dpf control dat:mitoRFP; dat:eGFP; elavl3:Gal4 and dat:mitoRFP; dat:eGFP; elavl3:Gal4; UAS:fynY531F larval brain. Right: quantification of overlap of eGFP and mCherry signal in vDC neuron cell bodies in 5 dpf control dat:mitoRFP; dat:eGFP; elavl3:Gal4 and dat:mitoRFP; dat:eGFP; elavl3:Gal4; UAS:fynY531F larvae (n=6). Statistical analysis was performed with two-tailed unpaired Student’s t-test. Bars represent mean±s.e.m. *P<0.05; **P<0.01; ***P<0.001. Scale bars: 50 µm (white); 100 µm (black).
|
