FIGURE SUMMARY
Title

Olfactory Dysfunction in a Novel Model of Prodromal Parkinson's Disease in Adult Zebrafish

Authors
Vorhees, N.W., Groenwold, S.L., Williams, M.T., Putt, L.S., Sanchez-Gama, N., Stalions, G.A., Taylor, G.M., Van Dort, H.E., Calvo-Ochoa, E.
Source
Full text @ Int. J. Mol. Sci.

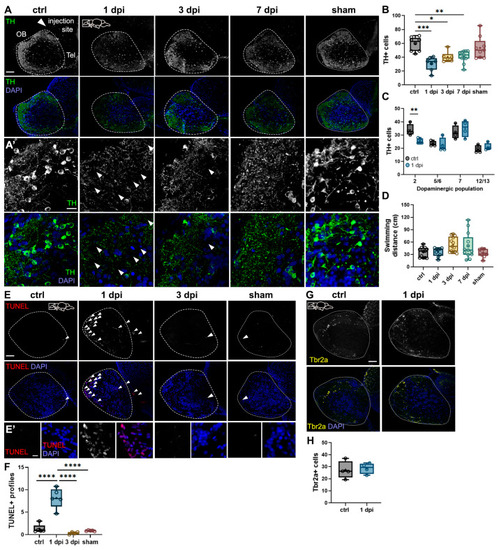
Effects of 6-OHDA injections on the zebrafish brain. (A,A′) Tyrosine hydroxylase (TH) immunohistochemistry of sagittal sections of the OB from control, 1-day post-injection (dpi), 3 dpi, 7 dpi, and sham fish. 6-OHDA injection site at the dorsal telencephalic ventricle near the telencephalon (Tel) is shown with a white arrowhead in the top left panel. Dotted lines indicate the OB. (A′) Magnified views of (A). Increased spacing in TH+ staining is indicated with white arrowheads. Green: TH; blue: DAPI. Scale bars: 100 µm in (A); 20 µm in (A′). (B) Quantification of the average number of TH+ cells in sagittal sections of the OB from (A) (n = 6–11). ANOVA: F (4, 36) = 8.34, p < 0.0001. ctrl vs. 1 dpi p = 0.0001, ctrl vs. 3 dpi p = 0.0025, ctrl vs. 7 dpi p = 0.0088. (C) Quantification of the average number of TH+ cells in dopaminergic populations 2, 5/6, 7, and 12/13 from sagittal sections of control and 1 dpi fish (n = 4). For population 2: t = 3.883, df = 7, p = 0.0060. (D) Quantification of swimming responses in control, 1 dpi, 3 dpi, 7 dpi, and sham fish (n = 9–12). (E) (TdT) dUTP Nick-End Labeling (TUNEL) staining in sagittal sections of the OB from control, 1 dpi, 3 dpi, and sham groups. TUNEL+ profiles are indicated with white arrowheads. Red: TUNEL; blue: DAPI. Scale bars: 100 µm in (E); 20 µm in (E′). (F) Quantification of average TUNEL+ profiles in OB sections from (E) (n = 4–5). ANOVA: F (3, 15) = 40.03, p < 0.0001. ctrl vs. 1 dpi p < 0.0001, 1 dpi vs. 3 dpi p < 0.0001, 1 dpi vs. sham p < 0.0001. (G) Tbr2a immunohistochemistry of sagittal sections of the OB from control and 1 dpi groups. Yellow: Tbr2a; blue: DAPI. Scale bar: 100 µm. (H) Quantification of Tbr2a+ cells in OB sections from (G) (n = 4). Box plots indicate mean (+), quartiles (boxes) and range (whiskers). One-way ANOVA or unpaired t-test for (C), * p < 0.005, ** p < 0.001, *** p = 0.0009, **** p < 0.0001.

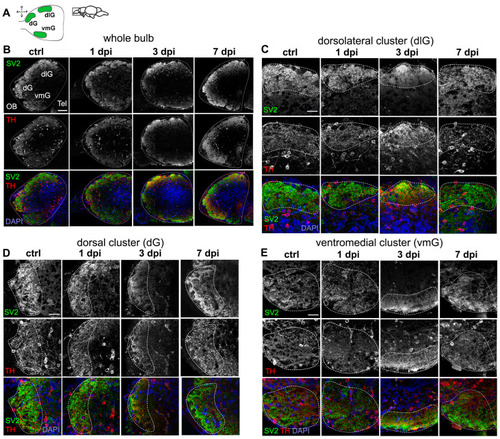
Dysregulation of synaptic contacts in the OB caused by 6-OHDA. (A) Schematic diagram of a sagittal view of the OB, indicating three glomerular clusters: dorsal (dG), dorsolateral (dlG), and ventromedial (vmG). (BE) Double immunohistochemistry of synaptic vesicle protein 2 (SV2) and tyrosine hydroxylase (TH) in sagittal sections of the OB from controls, 1 dpi, 3 dpi, and 7 dpi groups. Representative images taken from 5–7 animals analyzed per group. Dotted lines indicate the glomerular clusters selected. Whole bulb (B), and magnified views of: (C) dlG cluster, (D) dG cluster, and (E) vmG cluster. Green: Tbr2a; red: TH; blue: DAPI. Scale bars: 100 µm in (B); 50 µm in (CE).

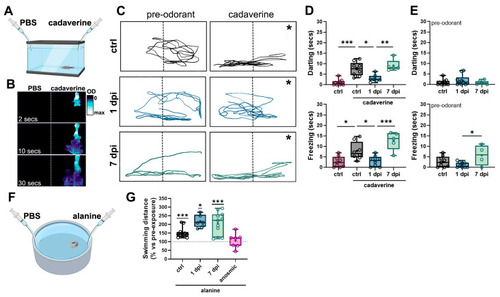
6-OHDA injections selectively reduce olfactory-mediated responses. (A) Schematic representation of the behavioral chamber used for studying responses to cadaverine. A rectangular, narrow chamber with a camera located in front was used to study fish’ vertical displacement following cadaverine exposure. (B) Time course of a dye distribution in the behavioral chamber from (A) indicating that odorant solutions remain in half of the chamber (indicated by a dotted line) during 30 s after cadaverine delivery. In (C), the asterisk (*) indicates the position where cadaverine solution was administered. (C) Representative swimming trajectories of zebrafish pre-(30 s) and post-(30 s) cadaverine delivery in controls (upper panels), 1 dpi (middle panels), and 7 dpi (lower panels) fish. (D) Quantification of swimming responses to cadaverine in controls, 1 dpi, 3 dpi, and 7 dpi (n = 5–10 fish). Top panel: time spent darting after cadaverine exposure. ANOVA F (3, 27) = 19.93, p < 0.0001. ctrl vs. control cad p < 0.0001, ctrl cad vs. 1 dpi p = 0.0033, 1 dpi vs. 7 dpi p = 0.0007. Bottom panel: time spent freezing after cadaverine exposure. ANOVA F (3, 26) = 12.28, p < 0.0001. ctrl vs. control + cad p = 0.0206, ctrl cad vs. 1 dpi p = 0.0379, 1 dpi vs. 7 dpi p = 0.0002. (E) Quantification of darting (top panel) and freezing (bottom panel) before odorant exposure (n = 4–9 fish). For freezing: ANOVA F (2, 19) = 4.088, p = 0.0334. 1 dpi vs. 7 dpi p = 0.0261. (F) Schematic representation of the behavioral chamber used for studying responses to alanine. A larger circular chamber with an overhead camera was used to study fish’ swimming distance following alanine exposure. (G) Quantification of swimming responses to alanine compared against pre-odorant exposure in controls, 1 dpi, 3 dpi, 7 dpi, and anosmic fish (n = 6–12 fish). One-sample Wilcoxon test when compared to baseline of 100% (no change). ctrl = p = 0.0005, 1 dpi p = 0.0312, 7 dpi p = 0.0010. * p < 0.005, ** p < 0.001, *** p = 0.0009.

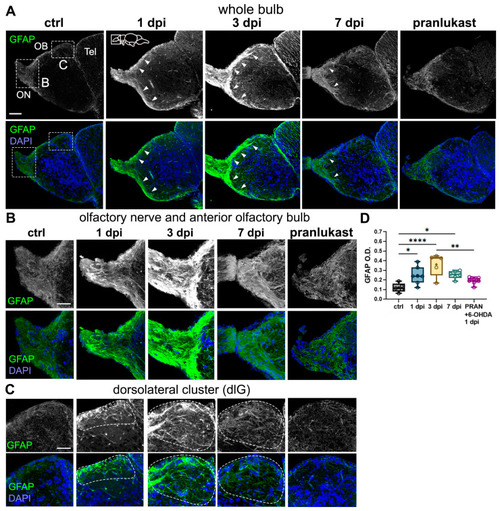
6-OHDA injections lead to astroglial activation in the OB. (AC) Glial fibrillary acidic protein (GFAP) immunohistochemistry in sagittal sections of the OB from controls, 1 dpi, 3 dpi, 7 dpi, and 6-OHDA with the anti-inflammatory drug pranlukast (PRAN). Whole bulb (A) and magnified views of: (B) the olfactory nerve and anterior OB, and (C) the dorsolateral (dlG) glomerular cluster (indicated by dotted lines). GFAP+ staining along the olfactory nerve layer (ONL) is indicated with white arrowheads. Green: GFAP; blue: DAPI. Scale bars: 100 µm in (A); 50 µm in (B,C). (D) Quantification of GFAP O.D. in OB sections from (A) (n = 5–9). ANOVA: F (4, 27) = 8.478, p = 0.0001. ctrl vs. 1 dpi p = 0.0306, ctrl vs. 3 dpi p < 0.0001, ctrl vs. 7 dpi p = 0.0275. 1 dpi vs. 3 dpi p < 0.0001. 3 dpi vs. PRAN p = 0.0017. Box plots indicate mean (+), quartiles (boxes) and range (whiskers). One-way ANOVA, * p < 0.005, ** p < 0.001, **** p < 0.0001.

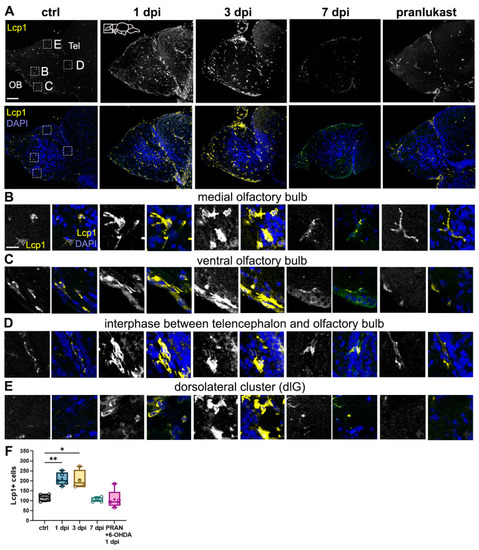
Microglial activation and leukocyte migration in the OB following 6-OHDA injection. (AE) Lymphocyte cytosolic protein 1 (Lcp1) immunohistochemistry in sagittal sections of the OB from controls, 1 dpi, 3 dpi, 7 dpi, and 6-OHDA with the anti-inflammatory drug pranlukast (PRAN). Whole bulb (A) and magnified views of: (B) middle region of the OB, (C) dlG cluster region, (D) ventral region, and (E) the interphase between the telencephalon and the OB. Yellow: Lcp1; blue: DAPI. Scale bars: 100 µm in (A); 20 µm in (BE). (F) Quantification of Lcp1+ cells in OB sections from (A) (n = 4–5). ANOVA: F (4, 17) = 10.66, p = 0.0002. ctrl vs. 1 dpi p = 0.0074, ctrl vs. 3 dpi p = 0.0151, ctrl vs. 7 dpi p = 0.0028, 1 dpi vs. 7 dpi p = 0.0028, 1 dpi vs. PRAN p = 0.0019, 3 dpi vs. 7 dpi p = 0.0061, 3 dpi vs. PRAN p = 0.0046. Box plots indicate mean (+), quartiles (boxes) and range (whiskers). One-way ANOVA, * p < 0.005, ** p < 0.001.

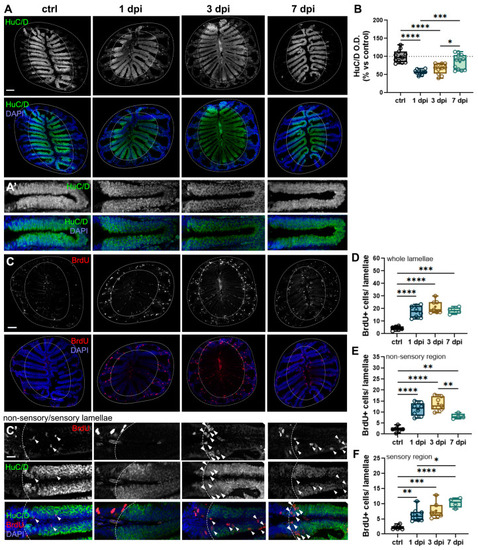
6-OHDA injections in the OB cause retrograde degeneration in the OE. (A,A′) HuC/D immunohistochemistry of OE sections from controls, 1 dpi, 3 dpi, and 7 dpi groups. (A’) are magnified views of the OSN-containing sensory lamellae (HuC/D+) from (A). Scale bars: 100 µm in (A); 20 µm in (A′). (B) Quantification of percent change (vs. control) in optical density (O.D.) of HuC/D in the OE from (A) (n = 11–12). ANOVA F (3, 41) = 16.78, p < 0.0001. ctrl vs. 1 dpi p < 0.0001, ctrl vs. 3 dpi p < 0.0001, 1 dpi vs. 7 dpi p = 0.0005, 3 dpi vs. 7 dpi p = 0.0286. (C,C′) Double immunohistochemistry of BrdU and HuC/D in sections of the OE of controls, 1 dpi, 3 dpi, and 7 dpi fish. (C′) Magnified views of (C), showing the sensory and non-sensory regions of the OE lamellae (indicated by dashed lines and HuC/D staining). BrdU+ cells found in the sensory area (HuC/D+) are indicated with white arrowheads. Red: BrdU; green: HuC/D; blue: DAPI. Scale bars: 100 µm in (C); 20 µm in (C′). (D) Quantification of BrdU+ cells in whole lamellae from (A) (n = 4–8). ANOVA F (3, 21) = 21.26, p < 0.0001. ctrl vs. 1 dpi p < 0.0001, ctrl vs. 3 dpi p < 0.0001, ctrl vs. 7 dpi p = 0.0002. (E) Quantification of BrdU+ cells in the non-sensory lamellae from (A) (n = 4–8). ANOVA F (3, 21) = 25.83, p < 0.0001. ctrl vs. 1 dpi p < 0.0001, ctrl vs. 3 dpi p < 0.0001, ctrl vs. 7 dpi p = 0.0073, 3 dpi vs. 7 dpi p = 0.0075. (F) Quantification of BrdU+ cells in the sensory lamellae (HuC/D+) from (A) (n = 4–8). ANOVA F (3, 21) = 14.86, p < 0.0001. ctrl vs. 1 dpi p = 0.0046, ctrl vs. 3 dpi p = 0.0004, ctrl vs. 7 dpi p < 0.0001, 3 dpi vs. 7 dpi p = 0.0075, 1 dpi vs. 7 dpi p = 0.0205. Box plots indicate mean (+), quartiles (boxes) and range (whiskers). One-way ANOVA, * p < 0.005, ** p < 0.001, *** p = 0.0009, **** p < 0.0001.

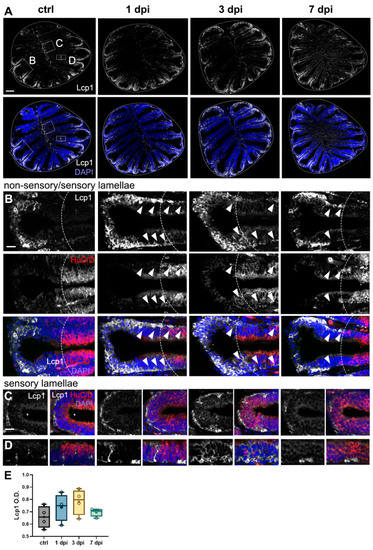
Leukocytic migration within the OE caused by 6-OHDA injections in the OB. (AD) Lymphocyte cytosolic protein 1 (Lcp1) immunohistochemistry in sections of the OE from controls, 1 dpi, 3 dpi, and 7 dpi. Whole OE (A) and magnified views of the following: (B) distal epithelial fold region, where the OSN-containing sensory region is indicated by HuC/D staining and a dotted line; (C) medial sensory region (HuC/D+) adjacent to the central raphe; and (D) sensory epithelium (HuC/D+). Migration of Lcp1+ cells is indicated by white arrowheads. White: Lcp1; blue: DAPI. Scale bars: 100 µm in (A); 20 µm in (BD). (E) Quantification of Lcp1+ cells in OE sections from (A) (n = 4). ANOVA: F (3, 12) = 1.42, p = 0.2840. Box plots indicate mean (+), quartiles (boxes), and range (whiskers).

Acknowledgments
This image is the copyrighted work of the attributed author or publisher, and ZFIN has permission only to display this image to its users. Additional permissions should be obtained from the applicable author or publisher of the image. Full text @ Int. J. Mol. Sci.