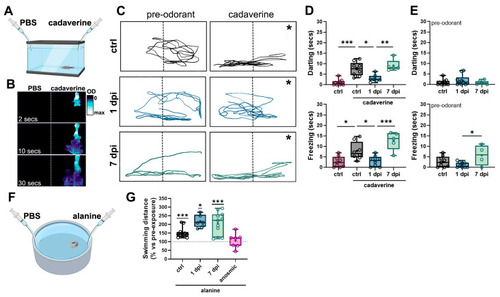
6-OHDA injections selectively reduce olfactory-mediated responses. (A) Schematic representation of the behavioral chamber used for studying responses to cadaverine. A rectangular, narrow chamber with a camera located in front was used to study fish’ vertical displacement following cadaverine exposure. (B) Time course of a dye distribution in the behavioral chamber from (A) indicating that odorant solutions remain in half of the chamber (indicated by a dotted line) during 30 s after cadaverine delivery. In (C), the asterisk (*) indicates the position where cadaverine solution was administered. (C) Representative swimming trajectories of zebrafish pre-(30 s) and post-(30 s) cadaverine delivery in controls (upper panels), 1 dpi (middle panels), and 7 dpi (lower panels) fish. (D) Quantification of swimming responses to cadaverine in controls, 1 dpi, 3 dpi, and 7 dpi (n = 5–10 fish). Top panel: time spent darting after cadaverine exposure. ANOVA F (3, 27) = 19.93, p < 0.0001. ctrl vs. control cad p < 0.0001, ctrl cad vs. 1 dpi p = 0.0033, 1 dpi vs. 7 dpi p = 0.0007. Bottom panel: time spent freezing after cadaverine exposure. ANOVA F (3, 26) = 12.28, p < 0.0001. ctrl vs. control + cad p = 0.0206, ctrl cad vs. 1 dpi p = 0.0379, 1 dpi vs. 7 dpi p = 0.0002. (E) Quantification of darting (top panel) and freezing (bottom panel) before odorant exposure (n = 4–9 fish). For freezing: ANOVA F (2, 19) = 4.088, p = 0.0334. 1 dpi vs. 7 dpi p = 0.0261. (F) Schematic representation of the behavioral chamber used for studying responses to alanine. A larger circular chamber with an overhead camera was used to study fish’ swimming distance following alanine exposure. (G) Quantification of swimming responses to alanine compared against pre-odorant exposure in controls, 1 dpi, 3 dpi, 7 dpi, and anosmic fish (n = 6–12 fish). One-sample Wilcoxon test when compared to baseline of 100% (no change). ctrl = p = 0.0005, 1 dpi p = 0.0312, 7 dpi p = 0.0010. * p < 0.005, ** p < 0.001, *** p = 0.0009.
|
