
- Title
-
Microglia-Derived IL-6 Promotes Müller Glia Reprogramming and Proliferation in Zebrafish Retina Regeneration
- Authors
- Xu, J., Li, Y., Li, X., Tan, X., Liu, L., Cao, L., Xu, H.
- Source
- Full text @ Invest. Ophthalmol. Vis. Sci.
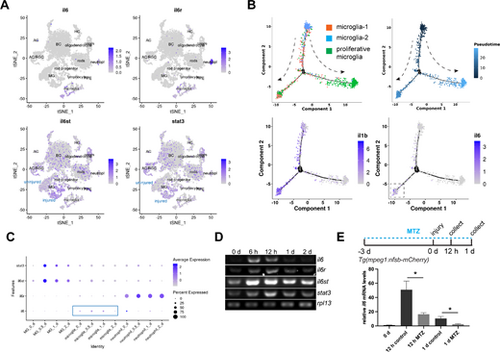
Expression of the IL-6 signaling components in control and stab-injured zebrafish retinas. (A) Single-cell RNAseq analysis showing the expression of il6, il6r, il6st, and stat3 in adult zebrafish retina. (B) Pseudotime analysis showing the expression of il6 and il1b during microglia status transition. The dashed arrows show the direction of the status transition. (C) Dotplot showing the expression of IL-6 signaling component genes in MG, microglia, and neutrophil. (D) PCR analysis showing the expression of il6, il6r, il6st, stat3, and house-keeping gene rpl13 at the indicated time points in zebrafish retina. (E) Microglia ablation using the Tg(mpeg1:nsfB-mCherry) transgenic zebrafish combined with metronidazole (MTZ) treatment abolished injury-dependent retinal il6 expression at 12 hpi and 1 dpi, as shown by qPCR. *, P < 0.05. AC, amacrine cells; BC, bipolar cells; HC, horizontal cells; MG, Müller glia; MTZ, metronidazole; RGC, retinal ganglion cells; RPE, retinal pigment epithelium; tSNE, t-Distributed Stochastic Neighbor Embedding. |

Intravitreous injection of zebrafish IL-6 activates Jak-Stat3 signaling and enhances the inflammatory response in injured zebrafish retinas. (A, B) The qPCR analysis showing the mRNA expression of Jak-Stat3 signaling component genes (stat3, il6st, il6r, socs3a, and socs3b) and inflammatory cytokines (il1b, il6, il11a, il11b, tnfa, and tnfb), in the uninjured control, or stab-injured retinas that received daily intravitreal IL-6 or PBS injection at 1 or 2 dpi. (C, D, E) IL-6 injection significantly increased the number and spatial distribution of IB4+ microglia at the injury site at 2 dpi. White *, site of the stab injury. (F) EdU immunofluorescence showing the cell proliferation in PBS control or IL-6-treated retinas at 4 days post injection. (G) Quantification of the total number of INL EdU+ cells in the retina at 4 days post injection. *, P < 0.05; **, P < 0.01, ***, P < 0.001 compared with PBS control. GCL, ganglion cell layer; INL, inner nuclear layer; ONL, outer nuclear layer. |
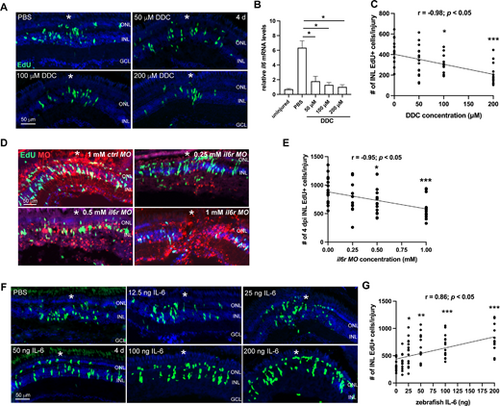
IL-6 promotes MGPC formation in the injured zebrafish retina. (A) EdU immunofluorescence showing the cell proliferation in PBS control or Di-O-demethylcurcumin (DDC)-treated retinas at 4 dpi. (B) The qPCR analysis of il6 mRNA levels in the PBS- or DDC-treated retinas at 12 hpi. Uninjured retina (0 day) served as a negative control. (C) Quantification of the number of INL EdU+ cells per injury at 4 dpi of A. (D) EdU immunofluorescence showing the cell proliferation in retinas electroporated with lissamine-tagged control (ctrl) MO or il6r MO at 4 dpi. (E) Quantification of the number of INL EdU+ cells per injury at 4 dpi of D. (F) EdU immunofluorescence showing the cell proliferation in retinas treated with PBS control or indicated doses of zebrafish IL-6 at 4 dpi. (G) Quantification of the number of INL EdU+ cells per injury in PBS or IL-6-treated retinas at 4 dpi. White *, site of the stab injury. *, P < 0.05; **, P < 0.01; ***, P <0.001. GCL, ganglion cell layer; INL, inner nuclear layer; ONL, outer nuclear layer; r, correlation coefficient. |
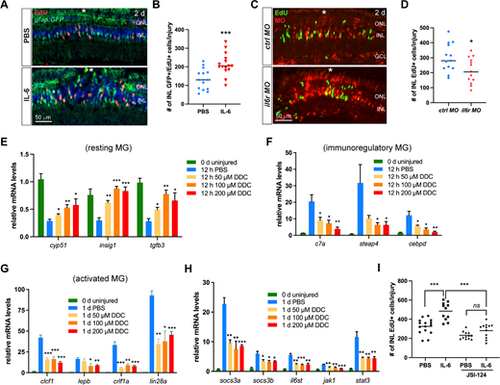
IL-6 regulates MG reprogramming and proliferation via Stat3 signaling. (A) EdU immunofluorescence showing the cell proliferation in retinas of the Tg(gfap:GFP) fish at 2 dpi. (B) Quantification of the number of INL GFP+ EdU+ cells per injury of A. (C) EdU immunofluorescence showing MG proliferation in the INL at 2 dpi. Retinas were electroporated with 1 mM of control or il6r MO at the time of the stab injury. (D) Quantification of the number of INL EdU+ cells per injury of C. (E, F, G, H) The qPCR analysis of the expression levels of MG subtype markers and Jak1-Stat3 signaling components in retinas treated with PBS or indicated doses of DDC. Day 0 served as the uninjured control. The statistical analyses were between DDC groups and PBS control. (I) JSI-124 treatment abolished the promoting effect of IL-6 on MG proliferation at 4 dpi. White *, site of the stab injury. *, P < 0.05; **, P < 0.01; ***, P <0.001; DDC, Di-O-demethylcurcumin; GCL, ganglion cell layer; INL, inner nuclear layer; ns, non-significant; ONL, outer nuclear layer. |

IL-6 may regulate MGPC formation through phase-dependent pro-inflammatory and anti-inflammatory mechanisms. (A) The experimental timeline, and EdU immunofluorescence showing the formation of MGPCs (INL EdU+ cells) in control or Dex-treated retinas at 4 dpi that received daily PBS- or IL-6 injection. (B) Quantification of the number of INL EdU+ MGPCs per injury in A. (C) Quantification of the number of IB4+ microglia at the injury site in retinas that received the same treatment of A at 2 dpi. (D) The experimental timeline, and EdU immunofluorescence showing the formation of MGPCs at 4 dpi in the retinas that received intravitreous injection of PBS, Dex, or Zym. (E) Quantification of the number of IB4+ microglia at the injury site in the retina in D at 4 dpi. (F) Quantification of the MGPC number per injury at 4 dpi in D. (G) The experimental timeline, and immunofluorescence showing the INL EdU+ MGPCs and IB4+ microglia at 4 dpi in retinas that received intravitreous injection of PBS or zebrafish IL-6 protein (100 ng). (H, I) Quantification of the number of MGPCs and IB4+ cells per injury in G at 4 dpi. (J) The experimental timeline, and qPCR analysis of the mRNA expression of indicated cytokines at 3 dpi in retinas that received intravitreous injection of PBS or zebrafish IL-6 protein (100 ng). White *, site of the stab injury. *, P < 0.05; **, P < 0.01; ***, P <0.001; Dex, dexamethason; GCL, ganglion cell layer; INL, inner nuclear layer; ns, non-significant; ONL, outer nuclear layer; Zym, zymosan A. |
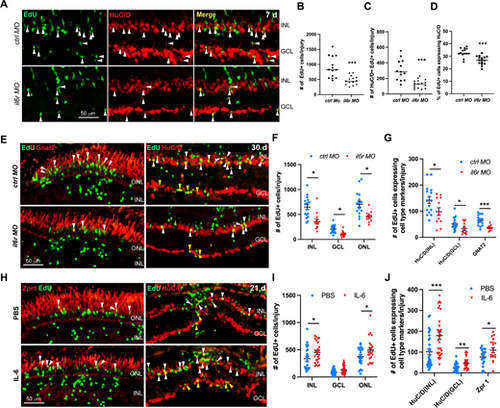
IL-6 signaling promotes the regeneration of retinal neurons in injured retinas. (A) EdU and HuC/D immunofluorescence showing the early MGPC differentiation at 7 dpi in retinas electroporated with 1 mM of control MO (ctrl MO) or il6r MO. (B, C, D) Quantification of the total number of EdU+ cells per injury B, the number of EdU and HuC/D double positive cells per injury C, and the proportion of EdU+ cells expressing HuC/D per injury D in A. (E) Immunofluorescence showing the regeneration of retinal neurons at 30 dpi in retinas electroporated with 1 mM of ctrl MO or il6r MO. (F) Quantification of the number of EdU+ cells in each layer per injury at 30 dpi in E. (G) Quantification of the number of regenerated photoreceptor (ONL Gnat+/EdU+), amacrine cells (INL HuC/D+/EdU+), and RGCs (GCL HuC/D+/EdU+) per injury at 30 dpi in E. (H) Immunofluorescence showing the regeneration of retinal neurons at 21 dpi in retinas treated with PBS control or IL-6. (I) Quantification of the number of EdU+ cells in each layer per injury at 21 dpi in H. (J) Quantification of the number of regenerated photoreceptor (ONL Zpr1+/EdU+), amacrine cells (INL HuC/D+/EdU+), and RGCs (GCL HuC/D+/EdU+) per injury at 21 dpi in H. *, P < 0.05; **, P < 0.01; ***, P <0.001; GCL, ganglion cell layer; INL, inner nuclear layer; ONL, outer nuclear layer. |