
- Title
-
Optimizing gRNA selection for high-penetrance F0 CRISPR screening for interrogating disease gene function
- Authors
- Lin, S.J., Huang, K., Petree, C., Qin, W., Varshney, P., Varshney, G.K.
- Source
- Full text @ Nucleic Acids Res.
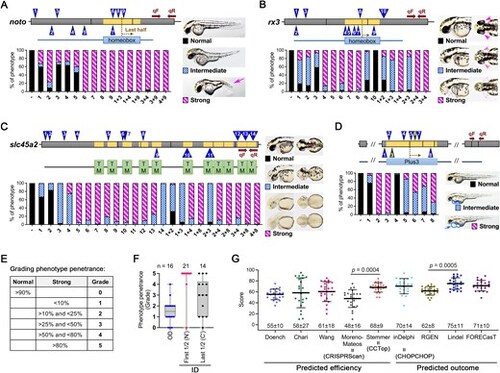
Examination of the relationship between predicted scores from online tools and phenotype penetrance for each gRNA. Four genes were selected based on the knockout phenotype, which includes (A) absence of notochord (arrow) in noto knockout at 2 dpf, (B) missing eyes (arrowheads) in rx3 knockout at 2 dpf, (C) lack of pigmentation in slc45a2 knockout at 3 dpf, and (D) pericardial edema (arrow and closed circle) in rtf1 knockout at 2 dpf. The gRNAs (indicated by numbered triangles) were designed across gene exons (gray boxes) and the corresponding functional domain (s) encoded by exons (yellow boxes) for each gene were displayed in colored boxes below. Brown arrows indicate the forward (qF) and reverse (qR) primer for RT-qPCR. The introns were removed to simplify the schematics. The injected animals were first categorized by morphological phenotype as shown in each figure in the right panel and then calculated as a percentage of the total. The editing efficiency of each gRNA was analyzed using TIDE and ICE. (E) Grade 0 indicates that over 90% of injected animals for a gRNA exhibit no effect on phenotype; Grade 1 indicates that less than 10% fall into the strong category; Grade 2 indicates that between 10% and less than 25% are in the strong category; Grade 3 indicates that between 25% and less than 50% belong to the strong category; Grade 4 indicates that between 50% and less than 80% are categorized in the strong category; Grade 5 indicates that over 80% are classified in the strong category. (F) Quantification of phenotype penetrance for gRNAs targeting outside (OD) and inside (ID) of the functional domain. Each dot represents one gRNA. (G) A scatter plot was used to visualize the distribution of predicted scores for a gRNA generated from different online tools. Each dot represents one gRNA, and the mean value ± standard deviation (SD) of each group is placed at the bottom of the respective bar in the figure.. |
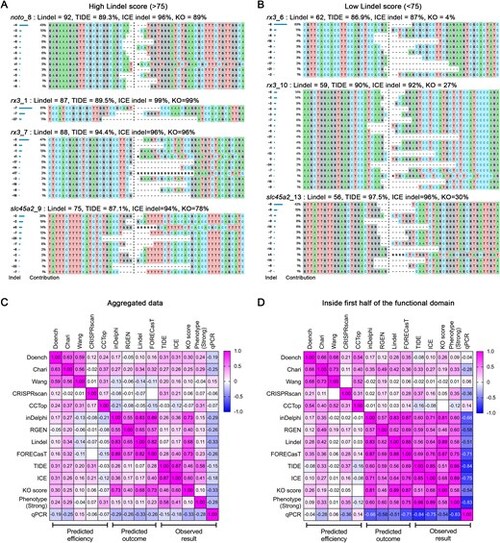
Predicted versus observed knockout efficiency correlations and Indel distributions across gRNAs. Synthego ICE analysis showing indel distributions for each gRNA scoring >75 in Lindel shown in (A) and those scoring <75 shown in (B). Panels (C) and (D) present heatmap visualizations of Pearson correlations between observed results and various prediction tools, including editing efficiency (TIDE and ICE), knockout (KO) score, strong phenotype penetrance, and RT-qPCR. Panel (C) summarizes aggregated data, while panel (D) focuses on gRNAs targeting the first half of the functional domain. Positive correlations (Pearson coefficient r > 0) are shown in magenta, while negative correlations (r < 0) are displayed in blue. |
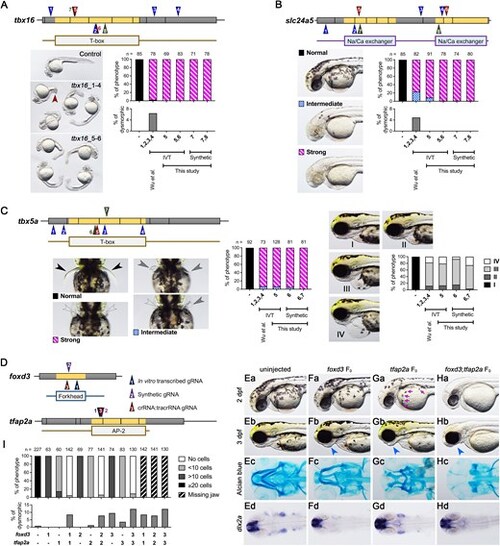
Comparison of phenotype penetrance across current F0 knockout methods. gRNAs targeting tbx16 (A), slc24a5 (B), and tbx5a (C) were obtained either from the methods described by Wu et al. (gRNAs 1–4; blue triangles) or our selection approach (gRNAs 5–8 for tbx16 and slc24a5, and gRNAs 5–7 for tbx5a; brown triangles). These gRNAs were synthesized via IVT or chemical synthesis (green triangles). (A) Tbx16 F0 embryos exhibited a curved tail phenotype at 1 dpf. The brown arrowhead highlights a kinked tail phenotype, which is distinct from the commonly observed curved tail phenotype in tbx16 knockouts. (B) At 2 dpf, slc24a5 F0 embryos displayed a lack of pigment cells, although some F0embryos exhibited dysmorphic phenotypes (Supplementary Fig. S2D). (C) Tbx5a F0 embryos showed both pectoral fin loss and heart edema at 3 dpf. Black arrowheads indicate normal pectoral fins, gray arrowheads indicate shorter or kinked fins, and empty arrowheads denote the absence of pectoral fins. Representative images of heart edema graded I to IV, and corresponding quantifications post-injection are presented in the right panel. (D) Cartoon diagrams illustrate gRNA positions: synthesized via IVT (gRNA_1), chemically synthesized (gRNA_2), or chemically synthesized and assembled into crRNA:tracrRNA complexes (gRNA_3) for foxd3 and tfap2a genes. (E–H) Representative phenotypes for uninjected, foxd3 F0, tfap2a F0, and foxd3;tfap2a F0 embryos include pigmentation phenotypes at 2 dpf (Ea-Ha), aberrant lower jaw morphology at 3 dpf (Eb-Hb), abnormal Alcian blue cartilage staining at 5 dpf (Ec-Hc), and expression patterns of the pharyngeal arch progenitor marker dlx2a (Ed-Hd). Magenta arrows indicate pigment cells, while blue arrows denote aberrant lower jaws. (I) Phenotype quantifications were performed for the number of pigment cells on the yolk sac in 2 dpf embryos and for embryos with missing lower jaws at 3 dpf. Additional dysmorphic phenotypes are shown in Supplementary Fig. S2E. |
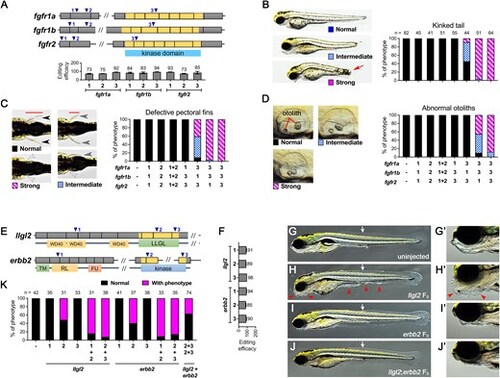
Multiplex mutagenesis for duplicated genes and synthetic rescue using F0 approach. (A) Schematics of gRNA target loci (blue triangle), gene exons (gray boxes) and their corresponding kinase domain (yellow boxes) for fgfr1a, fgfr1b and fgfr2 are shown. gRNA_1 and gRNA_2 target the beginning of the gene, while gRNA_3 targets the exon encoding the kinase domain. Editing efficiency for each gRNA was shown below. Representative phenotypic images for (B) kinked tail, (C) defective pectoral fins, and (D) abnormal otoliths of F0 animals at 3 dpf, along with their quantification results for different gRNA combinations, are presented. For phenotype categorization, animals showing either a kinked tail (indicated by red arrow in B), complete absence of both fins (C), or two otoliths stuck together (D) are considered in the strong category. (E) Schematics of gRNA target loci, exons, and corresponding functional domains for both llgl2 and erbb2 are depicted. The exons encoding LLGL domain for llgl2 and the kinase domain for erbb2 are shown in yellow boxes. (F) Editing efficiency for each gRNA. (G–J) Representative images for uninjected, llgl2 F0, erbb2 F0 and llgl2;erbb2 F0 at 5 dpf. The white arrow indicates the beginning position of the dorsal fin fold observed in erbb2 F0 knockouts, and red arrowheads indicated the uncontrolled proliferation of epidermal cells. The lower jaw image was enlarged in (G’-J’). Because these phenotypes are difficult to quantify the severity, animals showing excessive epidermal cells were counted with phenotype for llgl2 F0 knockouts, and animals showing aberrant dorsal fin fold and missing lower jaw were counted as phenotype for erbb2 F0 knockouts. For the llgl2;erbb2 F0 group, animals showing either excessive epidermal cells or aberrant dorsal fin fold or missing lower jaw were counted as phenotype. We didn’t see any dysmorphic (phenotypes other than characterized) animals in these experiments. (K) Quantifications of animals with phenotypes as shown in (G-J). |

Comprehensive transcriptomic analysis of uninjected and Cas9-injected control, F0, stable knockout, and rescued animals. (A) A Venn diagram compares DEGs in Cas9-injected versus uninjected embryos at 3 dpf. Three replicates indicate three independent runs of RNA-sequencing (RNA-seq), with each replicate containing biological triplicates (n = 6 embryos for each biological replicate). (B) Schematics of two gRNA target loci (blue triangle) and exons encoding kinase domain (yellow boxes) for the wars1 gene. The editing efficiency for each gRNA, injected either individually or in combination, is shown below. (C) Sequence alignment and chromatogram showing a 4bp deletion in the wars1 stable mutant generated by the wars1_2 gRNA, as revealed by Sanger sequencing. (D) Representative images of morphology for wars1 WT sibling (wars1+/+), homozygous knockout (wars1-/-), F0 and F0 rescued with human WARS1 mRNA embryos at 3dpf. Lateral view and anterior to the left. (E) A heatmap visualization of DEGs in uninjected (uninj.), Cas9 protein-injected (Cas9), wars1 F0, F0 rescued with zebrafish wars1 mRNA (F0 + zf), F0 rescued with human WARS1 mRNA (F0 + hm), wars1 WT sibling (+/+ sib) and homozygous knockout (-/- KO) animals from RNA-seq data. The genes used for heatmap visualization were a set of DEGs in the F0 versus uninjected group. (F) Another heatmap visualizes genes involved in aminoacyl-tRNA biosynthesis. (G and H) Volcano plots for wars1 F0 versus uninjected control and wars1-/- versus wars1+/+ sibling animals. Overlapped top DEGs are revealed on the figure. (I and J) KEGG pathway analysis shows DEGs enrichment in three groups (wars1 F0 versus uninjected, F0 versus Cas9, and wars1-/- versus wars1+/+ sibling) and is further divided into upregulation (I) and downregulation (J) groups. (K) Representative images of morphology for uninjected, med11 F0 and F0 rescued with human MED11 mRNA at 4 dpf are shown at the left panel. The heatmap at the right panel visualizes 1000 DEGs of uninjected, Cas9-injected, med11 F0, med11 F0 rescued with human MED11 mRNA, wars1 F0 and wars1 F0 rescued with human WARS1 mRNA animals at 3 dpf. Each group contains biological triplicates with six animals in each replicate. Note that one outlier in Cas9 group was removed in (E–J), and another in F0 + WARS1 group was removed in (K). For (A, E-K), the threshold cutoff was set to two-fold change (log2 fold change ≥ ±1) and a P-value less than 0.01. |
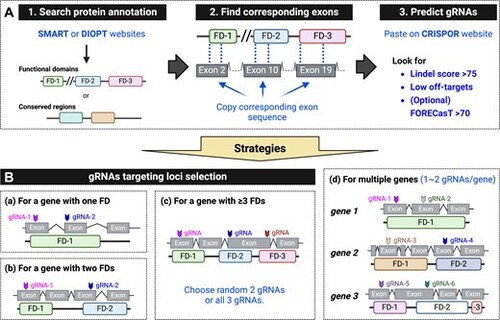
Standardized gRNAs selection and strategies for F0 mutagenesis. (A) Steps for finding a gRNA: (1) Identify functional domains (FDs) or conserved regions using resources like the SMART website (http://smart.embl-heidelberg.de/) or the DIOPT database (https://www.flyrnai.org/diopt). (2) Obtain the nucleotide sequence encoding the functional domain. (3) Enter the nucleotide sequence into the CRISPOR website (http://crispor.tefor.net/), select the desired genome and protospacer adjacent motif (PAM), and submit. Prioritize gRNAs with a Lindel score > 75 (outcome score), and as few off-target matches as possible. If no predicted values are shown, extend the input sequence by ∼200 base pairs. (B) Strategies for designing gRNAs to target loci in various scenarios: (a) For a gene encoding one FD, select two gRNAs: one targeting the beginning of the FD and another targeting the middle. (b) For a gene encoding two FDs, select two gRNAs, each targeting a different domain. (c) For a gene encoding more than three FDs, select two gRNAs targeting any two FDs, or three gRNAs targeting any three FDs. (d) For targeting multiple genes, select one to two gRNAs per gene, targeting FDs. Up to six gRNAs can be co-injected without observed toxicity. |

Utilizing the F0 approach to investigate the tissue-specific effects of genes with transgenic reporter lines or through immunohistochemistry. A transgenic line, Tg(olig2:DsRed2;mnx1:EGFP), was used to reveal the morphology of (A) the cerebellum (dorsal view; n = 3 embryos) and (B) motor neurons (n = 5 embryos) with red fluorescent protein driven by the olig2 promoter. (C) Fluorescent conjugated phalloidin staining was used to reveal actin filaments in the skeletal muscles of the fish trunk at 10 dpf (n = 6 larvae). Blue arrowheads indicate missing (loosened) muscle fibers. (D) Alcian blue staining and Tg(col2a1a:EGFP-CAAX) was used to reveal the structures of cartilages in cog1 F0 knockouts at 5 dpf (n = 10 larvae). The magenta arrow indicates aberrant cartilage development. A ventral view is shown. (E) Bright-field images revealed the cardiac development of animals (n = 4 larvae). The heart was outlined by blue lines, and the blue arrow indicates empty space in pericardium. BuA, bulbus arteriosus; V, ventricle; and A, atrium are indicated. A ventral view is shown. (F) Blood vasculature was revealed by Tg(kdrl:EGFP) at 5 dpf (n = 6 larvae). DLAV, dorsal longitudinal anastomotic vessel; ISV, intersegmental vessel; and DA, dorsal aorta. White asterisks indicate aberrant connected vessel, white arrow indicates defective angiogenesis and the white arrowhead indicates enlarged ISV. (G) Oil Red O staining was used to visualize the lipid accumulation in animals at 8 dpf (n = 35 larvae). Animals are presented in lateral view, with anterior to the left, unless specifically addressed. |

Functional analysis of NDD genes using F0 mutagenesis. (A–D) WISH method was performed to study mRNA expression patterns for atad3 at 1 dpf (A, A’), 2 dpf (B, B’), and 3 dpf (C, C’, C”), and for afg2b at 1 dpf (D) and 2 dpf (D’). (A, B, C, and D’), lateral view; and (A’, B’, C’, and D), dorsal view. (E –I) Representative images of morphology for uninjected (E and H), atad3 (F), afg2b (G), and cox4i1 (I) at 5 dpf. The blue line indicates head size, the red line indicates eye size, the black line indicates body length, magenta arrowheads indicate heart edema, and blue hashtags indicate missing swim bladder. Lateral view and anterior to the left. (J) Measurements of head and eye size, and body length of atad3 (n = 15), afg2b (n = 20), cox4i1 (n = 10) F0 knockouts. (K) Experimental procedures were conducted for three behavioral assays on F0 zebrafish larvae. Larvae, with or without injection at 4 dpf, were individually transferred to 96-well plates. The plates were then placed in the behavioral recording chamber on the following day (at 5 dpf) for the LDT test. Subsequently, the plates were moved to an incubator and left for an additional day for the VSR and AEBR assays. The animals' responses to each stimulus and their locomotion were tracked and analyzed using customized software. (L) A box and whisker plot was utilized to visualize the percentage of responses in F0 knockouts after VSR and AEBR assays, with a sample size of n = 24 larvae for each group. The percentage of responses to five light stimuli for VSR and the responses to 12 sound stimuli for AEBR were calculated for each larva. (M) Locomotor activities of zebrafish larvae in LDTs at 5 dpf, n = 48 larvae for each group. Larvae were habituated in the dark for 30 min, followed by three cycles of 5-min periods of light and dark. Error bars represent the mean ± SEM. D, dark period, L, light period. Blue arrows indicate the distance moved at the first minute lights on for atad3 F0 larvae, and magenta arrows indicate the increased distance moved during dark period of afg2b F0 larvae. (N) Average cumulative distance traveled by each larva during the first minute of the light period as indicated by blue arrow in (M). (O) Average cumulative distance traveled by each larva during three cycles of either light or dark periods. (P) Representative images of the uninjected control and atad3 F0 in Tg(tuba1a:nls-Kal4FF;UAS:GCaMP7a);nacre under bright-field (left panel) and fluorescent microscopy (middle panel) at 5 dpf. The schematic diagram illustrates the structure of the zebrafish larva brain at the top right panel, while the bottom right panel displays a fluorescent image of uninjected larvae treated with 15 mM pentylenetetrazole (PTZ) at 5 dpf. n = 3 larvae for each group. Dorsal view, anterior to the left. For (J, N, and O), each dot represents one larva, and error bars indicate the mean ± SD. For (J, L, and O), statistical significance was calculated by Brown–Forsthye and Welch's ANOVA with Dunnett's T3 multiple comparisons test; for (N), two-tailed unpaired Student's t test with Welch's correction: not significant (ns) P ≥ 0.05, *P < 0.05, **P < 0.01, and ****P < 0.0001. Di, diencephalon; E, eye; Tel, telencephalon; Ov, otic vesicle; Re, retina; Le, lens; Li, liver; In, intestine; Fb, forebrain; Mb, midbrain; Hb, hindbrain; TeO, optic tectum; Cb, cerebellum. |

Screening for genes involved in hearing and vestibular function by F0 approach. (A) The cartoon figure illustrates zebrafish larval sensory systems, including the inner ear and the neuromast in the lateral line. The inner ear contains the anterior macula (am) with an otolith attached to the ciliary bundles of macular hair cells, responsible for balance, and the posterior macula (pm) with an otolith attached to the ciliary bundles of macular hair cells, responsible for hearing. Additionally, there are three cristae for sensing angular rotation. Functional (mechanotransduction) and viable hair cells in the lateral line neuromast can uptake live nuclear dyes such as Yo-Pro-1. (B) A hearing gene screening pipeline was established. Embryos, both with and without microinjection, were rinsed with embryo water daily until 5 dpf for inner ear phenotyping and Yo-Pro-1 uptake experiments. The remaining larvae were individually transferred to 96-well plates for the AEBR assay at 6 dpf. (C) The WISH method was performed to study mRNA expression patterns for hearing genes. The blue arrowheads indicate the lateral line neuromast, the dashed close circle indicates the inner ear, and the red asterisk indicates the sensory epithelium in the inner ear. Stained embryos at 1 dpf for all genes, at 3 dpf for otol1a and otol1b in the left panel, and at 2 dpf for ptprq were displayed in dorsal view. The rest were shown in lateral view, with the anterior to the left. (D) Representative images of inner ear morphology for each F0 knockout. Scale bar = 0.1 mm. Lateral view with the anterior to the left. |

High-throughput hearing gene screening in F0 knockouts using Yo-Pro-1 and acoustic evoked behavior response (AEBR) assay. (A) Representative fluorescent images of Yo-Pro-1 uptake for each F0 with an enlarged image of a neuromast placed in the bottom right corner. The images are shown in lateral view with the anterior to the left. A homozygous cdh23 knockout (cdh23-/-) was used as a positive control for the hearing loss phenotype. For example, neuromast morphology can be observed under bright-field, but no Yo-Pro-1-positive (Yo-Pro-1+) cells are present. Images for other hearing genes were presented in Supplementary Fig. S22 and Supplementary Fig. S23. (B) Quantification of the average number of Yo-Pro-1+ cells per neuromast (n = 4 neuromasts) of each F0 knockout (n = 5 larvae). Since the average number of Yo-Pro-1 + cells per neuromast was around 10 cells for uninjected controls across multiple experiments, we combined all numbers (n = 45 larvae). Error bars indicate the mean ± SD. Statistical significance was compared to the uninjected control group and calculated by Brown–Forsthye and Welch's ANOVA with Dunnett's T3 multiple comparisons test: not significant (ns) P ≥ 0.05, *P < 0.05, ***P < 0.001, and ****P < 0.0001. (C) A stable homozygous cdh23 knockout (cdh23-/-) was used as a positive control for the hearing loss phenotype. The AEBR assay results for other hearing genes were presented in Supplementary Fig. S24 and Supplementary Fig. S25. The percentage of responses to 12 sound stimuli for AEBR was calculated for each larva using AEBR. Statistical significance was determined using two-tailed unpaired Student's t test with Welch's correction: not significant (ns) P ≥ 0.05, *P < 0.05, **P < 0.01, ***P < 0.001, and ****P < 0.0001 compared to uninjected controls from the same batch. |

Investigation of genetic compensation by inactivating upf3 paralogs in stable knockouts of hearing genes. (A) The msrb3 F0 knockouts exhibited a reduced AEBR compared to either Cas9-injected or upf3a;upf3b F0 knockout larvae. Similarly, msrb3 homozygous (Hom) knockouts showed a reduced AEBR compared to either WT or heterozygous (Het) larvae. RT-qPCR showed a significant reduction in tmprss3a, whereas tmprss3b was slightly reduced in both tmprss3a;tmprss3b heterozygous and homozygous knockouts. (B) The tmprss3a F0, tmprss3b F0, tmprss3a;tmprss3b F0, tmprss3aHom;tmprss3bHom and tmprss3aHom;tmprss3bHom coinjected with upf3a and upf3b gRNAs (tmprss3aHom;tmprss3bHom;upf3a;upf3b F0) showed a reduced AEBR compared to Cas9-injected larvae. Furthermore, tmprss3a;tmprss3b F0, tmprss3aHom;tmprss3bHom, and tmprss3aHom;tmprss3bHom;upf3a;upf3b F0 larvae exhibited a similar degree of reduction in AEBR assay. RT-qPCR showed a significant reduction in tmprss3a, whereas tmprss3b was slightly reduced in both tmprss3a;tmprss3b heterozygous and homozygous knockouts. (C-F) Comparisons of the AEBR assay for control versus F0, stable knockout, and stable knockout coinjected with upf3a and upf3b gRNAs in coch (C), tbc1d24 (D), pou4f3 (E), and gipc3 (F) genes showed no difference. RT-qPCR analysis was performed to determine the gene expression levels in each knockout, and the results are shown in the right panel. Each group was compared with every other group. The percentage of responses to 12 sound stimuli for AEBR were calculated for each larva. Statistical significance was calculated by Brown–Forsthye and Welch's ANOVA with Dunnett's T3 multiple comparisons test: not significant (ns) P ≥ 0.05, *P < 0.05, **P < 0.01, ***P < 0.001, and ****P < 0.0001. |