
- Title
-
Crip2 affects vascular development by fine-tuning endothelial cell aggregation and proliferation
- Authors
- Yang, S., Zhang, X., Li, X., Li, H.
- Source
- Full text @ Cell. Mol. Life Sci.
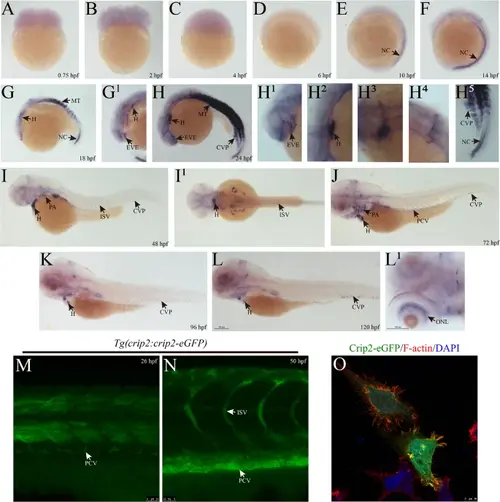
The expression profiles of zebrafish Crip2 during early vascular development. (A–L) Expression of crip2 determined via WISH in zebrafish early embryos. The figure marked with numbers in the upper right corner is a partial enlargement of the corresponding region. (M–N) Expression of Crip2 in early embryonic blood vessels of Tg(crip2:crip2-eGFP) zebrafish. The zebrafish transgenic line was constructed by expressing the Crip2-eGFP fusion under the control of the promoter region of crip2. Z-axis photography was performed, and the target areas were superimposed. (O) Subcellular localization of Crip2 in zebrafish via the transfection of pcDNA3.1-crip2-eGFP in HUVECs. TRITC-phalloidin and DAPI were used to stain F-actin and the nucleus, respectively. NC: notochord; MT: myotome; H: heart; EVE: eye blood vessel endothelial cell; CVP: caudal vein plexus; ISV: intersegmental vein; PA: pharyngeal arch; PCV: posterior cardinal vein; ONL: outer nuclear layer. hpf: hours post fertilization |
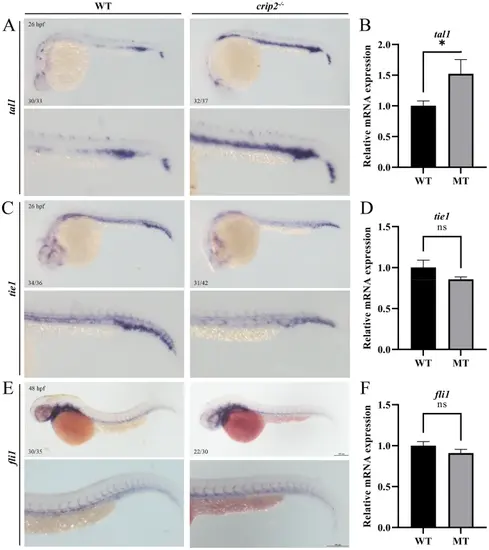
Disruption of crip2 impairs vascular development. (A, C, E) The expression profiles of the vascular markers, tal1, tie1, and fli1 were examined via WISH. (B, D, F) The relative mRNA expression levels of these genes were detected via qRT-PCR. Unpaired t-test; *, P < 0.05; ns, not significant |
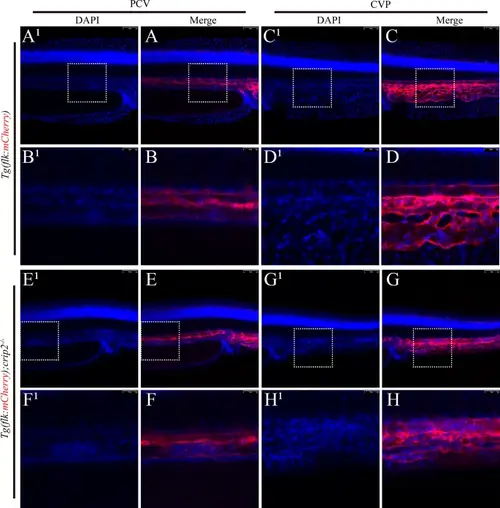
Loss of CRIP2 leads to aggregation of vascular endothelial cells. No endothelial cell aggregation was observed in the PCV (A, B) or CVP (C, D) of Tg(flk: mCherry) zebrafish embryos at 48 hpf. Aggregation of vascular endothelial cells was observed in the PCV (E, F) and CVP (G, H) of Tg(flk: mCherry); crip2−/− homozygous mutant embryos at 48 hpf. The embryos were stained with DAPI for nuclear visualization, with the left panel showing the embryonic trunk and the right panel showing the embryonic tail bud. The white dashed boxes indicate the areas that are magnified in the corresponding enlarged images located below in the figures. PCV: posterior cardinal vein; CVP: caudal vein plexus |
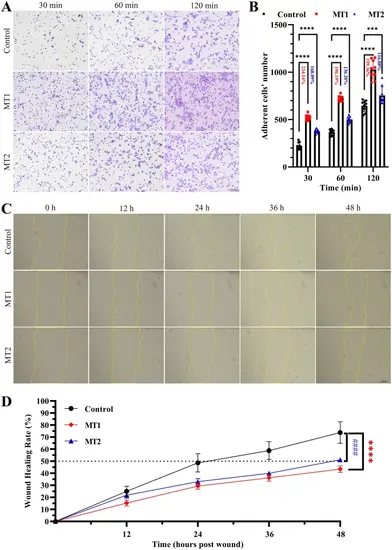
CRIP2 deficiency promotes cell adhesion and impairs cell migration in HUVECs. (A) CRIP2 loss promotes cell adhesion. HUVECs were collected and seeded onto fibronectin-coated plates for 30, 60, or 120 min. The cells were stained with crystal violet. The adherent cells were counted via ImageJ. (B) Quantitative analysis of cell adhesion in CRIP2-MT and control cell lines. Nine microscope fields from each group were randomly captured. The percentages represent the ratios of the number of adherent cells in the CRIP2-MT cell lines to that in the control groups. (C) CRIP2 loss impairs cell migration. HUVECs were collected, seeded and photographed at 0, 12, 24, 36, and 48 h after wounding. Wound closure was investigated via ImageJ. (D) Quantitative analysis of cell migration in CRIP2-MT and control cell lines. Six microscope fields from each group were randomly captured. Two-way ANOVA; #### or ****, P < 0.0001 |
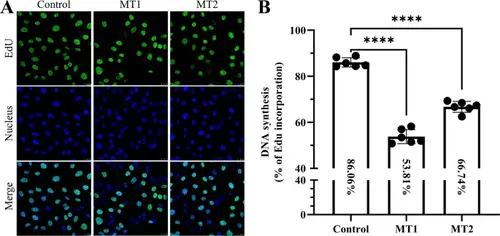
CRIP2 depletion decreases cell proliferation in HUVECs. (A) CRIP2 loss reduces cell proliferation, as determined by the EdU assay. Ten microscope fields from each group were randomly captured. The proliferative cells were counted via ImageJ. (B) Quantitative analysis of cell proliferation in CRIP2-MT and control cell lines. Six microscope fields from each group were randomly captured. The percentages represent the ratios of the number of EdU-positive cells to the total number of cells in the control and the MT1 and MT2 cell lines. One-way ANOVA; ****, P < 0.0001 |
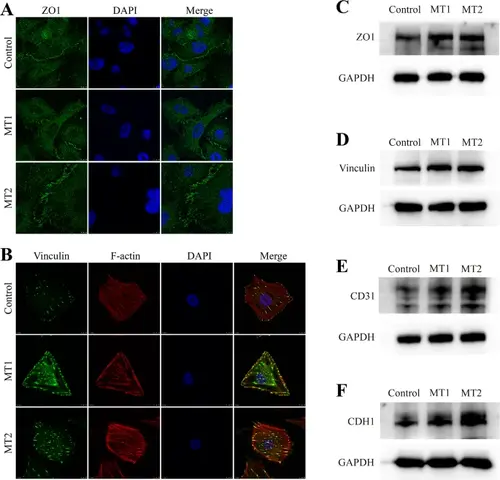
Cell adhesion proteins are upregulated following CRIP2 depletion. (A–B) ZO1 and Vinculin expression in the control and CRIP2-MT cell lines were determined by immunostaining. TRITC-phalloidin and DAPI were used to stain F-actin and the nucleus, respectively. (C-F) ZO1, vinculin, CD31 and CDH1 expression in the control and CRIP2-MT cell lines, as determined by Western blotting |
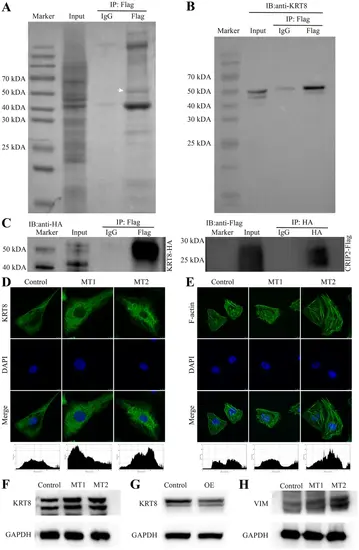
KRT8 interacts with CRIP2 and is negatively regulated by CRIP2. (A) Identification of potential CRIP2-interacting proteins by immunoprecipitation using a Flag antibody in CRIP2-Flag-overexpressing cell lines. The white arrow indicates the bands for mass spectrometry sequencing. (B) Validation of the interaction between KRT8 and CRIP2 via KRT8 antibody immunoblotting. (C) CRIP2 coimmunoprecipitates with KRT8. (D, E) The expression of KRT8 and F-actin in the absence of CRIP2. DAPI was used to stain the nucleus. Below the images are the fluorescence intensity analysis data. The x-axis represents the horizontal distance across the image from left to right, whereas the y-axis represents the gray value corresponding to the fluorescence intensity. (F) KRT8 expression in the absence of CRIP2, as determined by Western blotting. (G) KRT8 expression following CRIP2 overexpression, as determined by Western blotting. (H) Western blot analysis of Vimentin expression in the absence of CRIP2 |
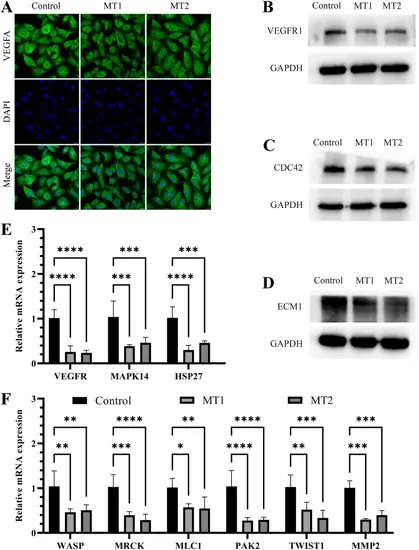
CRIP2 deficiency decreases the expression of factors related to cell migration. (A) Immunofluorescence analysis of VEGFA upon CRIP2 loss. DAPI was used to stain the nucleus. (B, C, D) The protein levels of ECM1, VEGFR1 and CDC42 were diminished in CRIP2-deficient cells. (E, F) qRT-PCR revealed a reduction in the expression of factors downstream of VEGFA/CDC42 following CRIP2 loss. Two-way ANOVA; *, P < 0.05; **, P < 0.01; ***, P < 0.001; ****, P < 0.0001 |
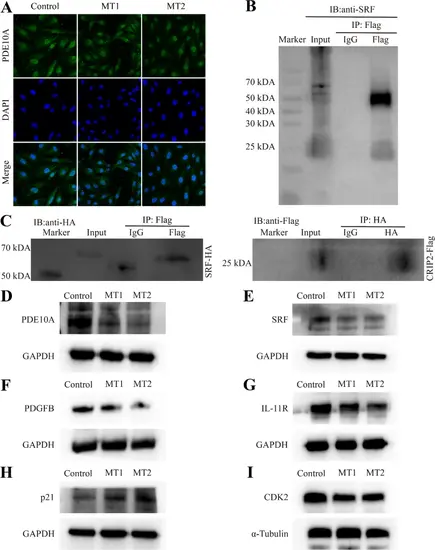
SRF interacts with CRIP2, and the expression of its downstream genes is modulated by CRIP2. (A) Immunofluorescence analysis of PDE10A expression after CRIP2 depletion. DAPI was used to stain the nucleus. (B) Detection of SRF in the immunoprecipitation derived from cell lines overexpressing CRIP2. (C) CRIP2 coimmunoprecipitates with SRF. (D–I) Analysis of the altered protein levels of PDE10A, SRF, PDGFB, IL-11R, p21, and CDK2 in response to CRIP2 deficiency |