
- Title
-
Knockout of the fcsk gene in zebrafish causes neurodevelopmental defects
- Authors
- Liu, Z.X., Zou, T.T., Liu, H.H., Jia, H.B., Zhang, X.Q.
- Source
- Full text @ Zool Res
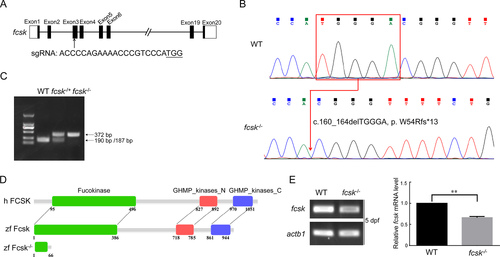
CRISPR/Cas9-mediated fcsk knockout in zebrafish A: CRISPR/Cas9 target sites in fcsk. B: Sanger sequencing confirmed a five-base deletion (c.160_164delTGGGA, p.W54Rfs*13) in F2 generation of fcsk−/− zebrafish. C: fcsk mutation abolished the NcoI cleavage site, preventing digestion of the PCR products in homozygous (fcsk−/−) zebrafish (372 bp). In contrast, PCR products from WT zebrafish were cleaved into 190 bp and 187 bp fragments, while heterozygous (fcsk+/−) zebrafish exhibited digestion of the WT allele, resulting in 372 bp, 190 bp, and 187 bp fragments. D: Protein structure of human FCSK (h FCSK), zebrafish WT Fcsk (zf Fcsk) and mutant Fcsk (zf Fcsk−/−). E: Relative mRNA levels of fcsk in fcsk−/− zebrafish (5 dpf) were detected by semi-quantitative RT-PCR. dpf: Days post-fertilization. Results are presented as mean±SEM, n=3. **: P<0.01. |
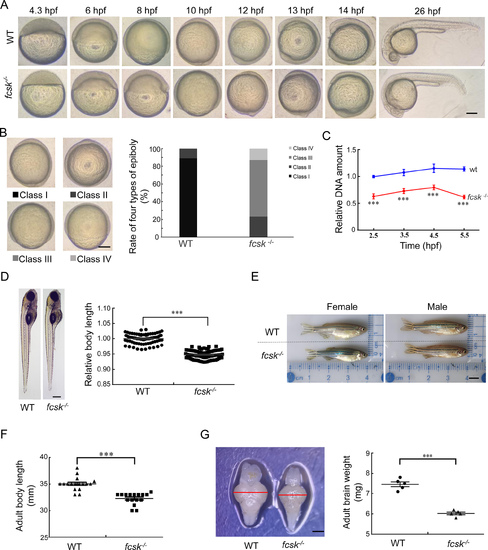
Developmental retardation and brain atrophy in fcsk−/− zebrafish A: Representative images showing developmental delay in fcsk−/− embryos from 4.3 hpf to 26 hpf. hpf: Hours post-fertilization. Scale bar: 200 µm. B: Classification of epiboly progression at 10 hpf into four stages: Class I (epiboly completed, tail bud formed), Class II (epiboly completed, no tail bud formed), Class III (approximately 85% epiboly), and Class IV (approximately 60% epiboly). The proportion of these types was quantified in WT and fcsk−/− embryos (100 per group). Scale bar: 200 µm. C: Quantitative DNA content analysis in WT and fcsk−/− embryos pre- and post-MBT (2.5–5.5 hpf). Thirty embryos were collected at each time point under identical culture conditions. n=3. D: Body length comparison of WT and fcsk−/− larvae (5 dpf, 80 larvae per group). Scale bar: 200 µm. E: Body length comparison of WT and fcsk−/− adult zebrafish (4.5 mpf, female and male). mpf: Months post-fertilization. Scale bar: 0.5 cm. F: Statistical analysis of adult body length in 17 WT and 16 fcsk−/− zebrafish. G: Brain size (left) and weight (right) of fcsk−/− zebrafish (4.5 mpf). n=5. Scale bar: 200 µm. Mean±SEM. ***: P<0.001. |
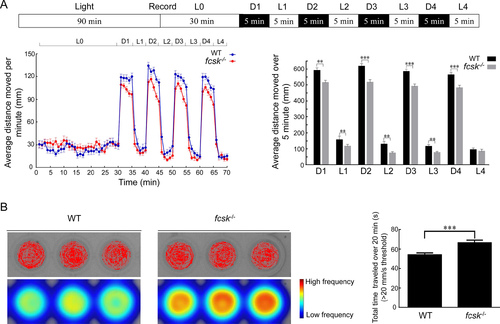
Light-dark stimulation and PTZ induction seizure susceptibility in zebrafish larvae A: Experimental protocol for light-dark stimulation test. Average distance traveled by fcsk−/− larvae (6 dpf) under light and dark stimuli. n=48 per genotype. L: Light; D: Dark. B: Representative trajectory plots and heatmaps of PTZ-induced larvae (6 dpf), and duration of high-speed movements (>20 mm/s threshold) was significantly increased in fcsk−/− larvae compared to WT controls. n=48 per genotype. Mean±SEM. **: P<0.01; ***: P<0.001 PHENOTYPE:
|
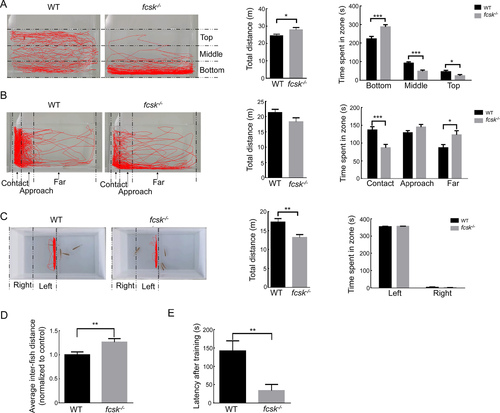
Behavioral assessments of adult zebrafish A: Novel tank test. Representative trajectory plots (left) and quantitative analysis (right) showing total movement distance and time spent in bottom, middle, and top regions in WT and fcsk−/− zebrafish (3 mpf, n=31 per group). B: Mirror biting test. Representative trajectory plots (left) and quantitative analysis (right) of total movement distance and time spent in contact, approach, and far zones in WT (n=23) and fcsk−/− (n=21) zebrafish (3 mpf). C: Social preference test. Representative trajectory plots (left) and quantitative analysis (right) showing a significant reduction in total movement distance in fcsk−/− zebrafish (3 mpf, n=20 per group), with no significant difference observed in time spent in left and right regions. D: Shoaling test. Average inter-fish distance was significantly increased in fcsk−/− zebrafish (3 mpf, n=24 per group), indicating reduced social cohesion. E: Modified T-maze test. fcsk−/− zebrafish (3 mpf) exhibited a significantly shorter latency to enter the punishment arm, suggesting impaired learning and memory function (n=24 per group). PHENOTYPE:
|
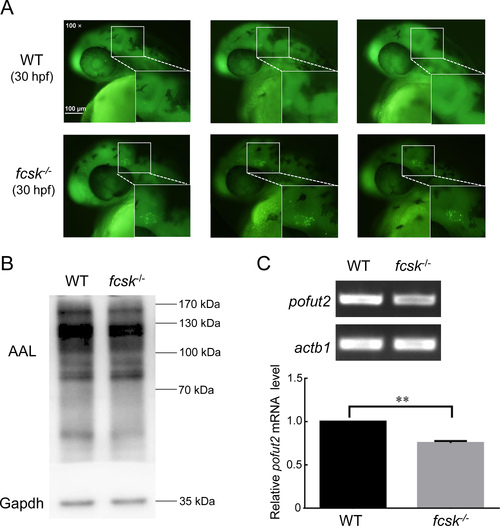
Increased apoptosis in midbrain-hindbrain boundary and decreased expression of fucosylated proteins and pofut2 in fcsk−/− zebrafish A: Representative acridine orange (AO) staining results of WT (n=22) and fcsk−/− (n=21) larvae (30 hpf). White box: Mid-hindbrain boundary. Enlarged images of white boxed areas are shown in lower right corner. Scale bar: 100 μm. B: Western and lectin blot analyses of WT and fcsk−/− zebrafish at 5 dpf. Gapdh was used as an internal control. n=20 larvae (5 dpf) per genotype. AAL: Aleuria aurantia lectin. n=3. C: Agarose gel electrophoresis (upper) and statistical analysis (lower) of semi-quantitative RT-PCR for pofut2 expression in WT and fcsk−/− zebrafish (5 dpf). n=3. Mean±SEM. **: P<0.01. |
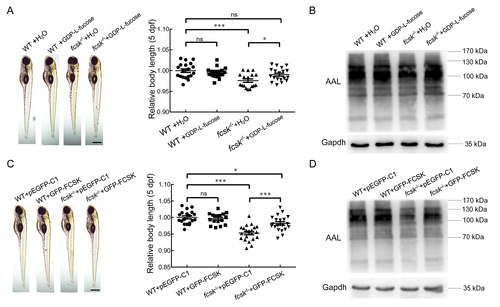
GDP-L-fucose and GFP-tagged human FCSK rescue early development and fucosylated protein levels in fcsk−/− zebrafish A: Body length and statistical analysis of WT (injected with H2O), WT (injected with GDP-L-fucose), fcsk−/− (injected with H2O), and fcsk−/− (injected with GDP-L-fucose) zebrafish (5 dpf, n=24). Scale bar: 200 µm. B: Western and lectin blot analyses of WT (injected with H2O), WT (injected with GDP-L-fucose), fcsk−/− (injected with H2O), and fcsk−/− (injected with GDP-L-fucose) zebrafish (48 hpf). C: Body length and statistical analysis of WT (injected with pEGFP-C1), WT (injected with GFP-tagged human FCSK), fcsk−/− (injected with pEGFP-C1), and fcsk−/− (injected with GFP-tagged human FCSK) zebrafish (5 dpf, n=19). Scale bar: 200 µm. D: Western and lectin blot analyses of WT (injected with pEGFP-C1), WT (injected with GFP-tagged human FCSK), fcsk−/− (injected with pEGFP-C1), and fcsk−/− (injected with GFP-tagged human FCSK) zebrafish (72 hpf). Mean±SEM. ns: Not significant; *: P<0.05; ***: P<0.001. |
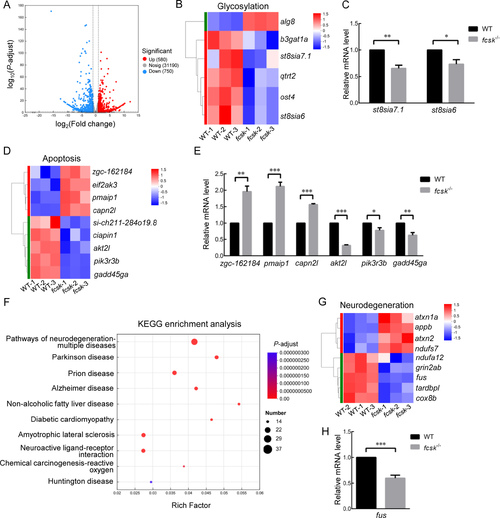
RNA-seq analysis of WT and fcsk−/− zebrafish A: Volcano plot of differentially expressed genes (DEGs) between WT and fcsk−/− zebrafish. Blue represents down-regulated genes (750), red represents up-regulated genes (580), gray represents genes with no significant difference. B: Clustering heatmap of glycosylation-related DEGs. C: mRNA levels of glycosylation-related DEGs detected by RT-qPCR (n=3). D: Clustering heatmap of apoptosis-related DEGs. E: mRNA levels of apoptosis-related DEGs detected by RT-qPCR (n=3). F: KEGG analysis of DEGs related to the nervous system. G: Clustering heatmap of DEGs homologous to human neurodegenerative disease-related genes. H: mRNA levels of neurodegeneration-related DEGs detected by RT-qPCR (n=3). Mean±SEM. *: P<0.05; **: P<0.01; ***: P<0.001. |