
|
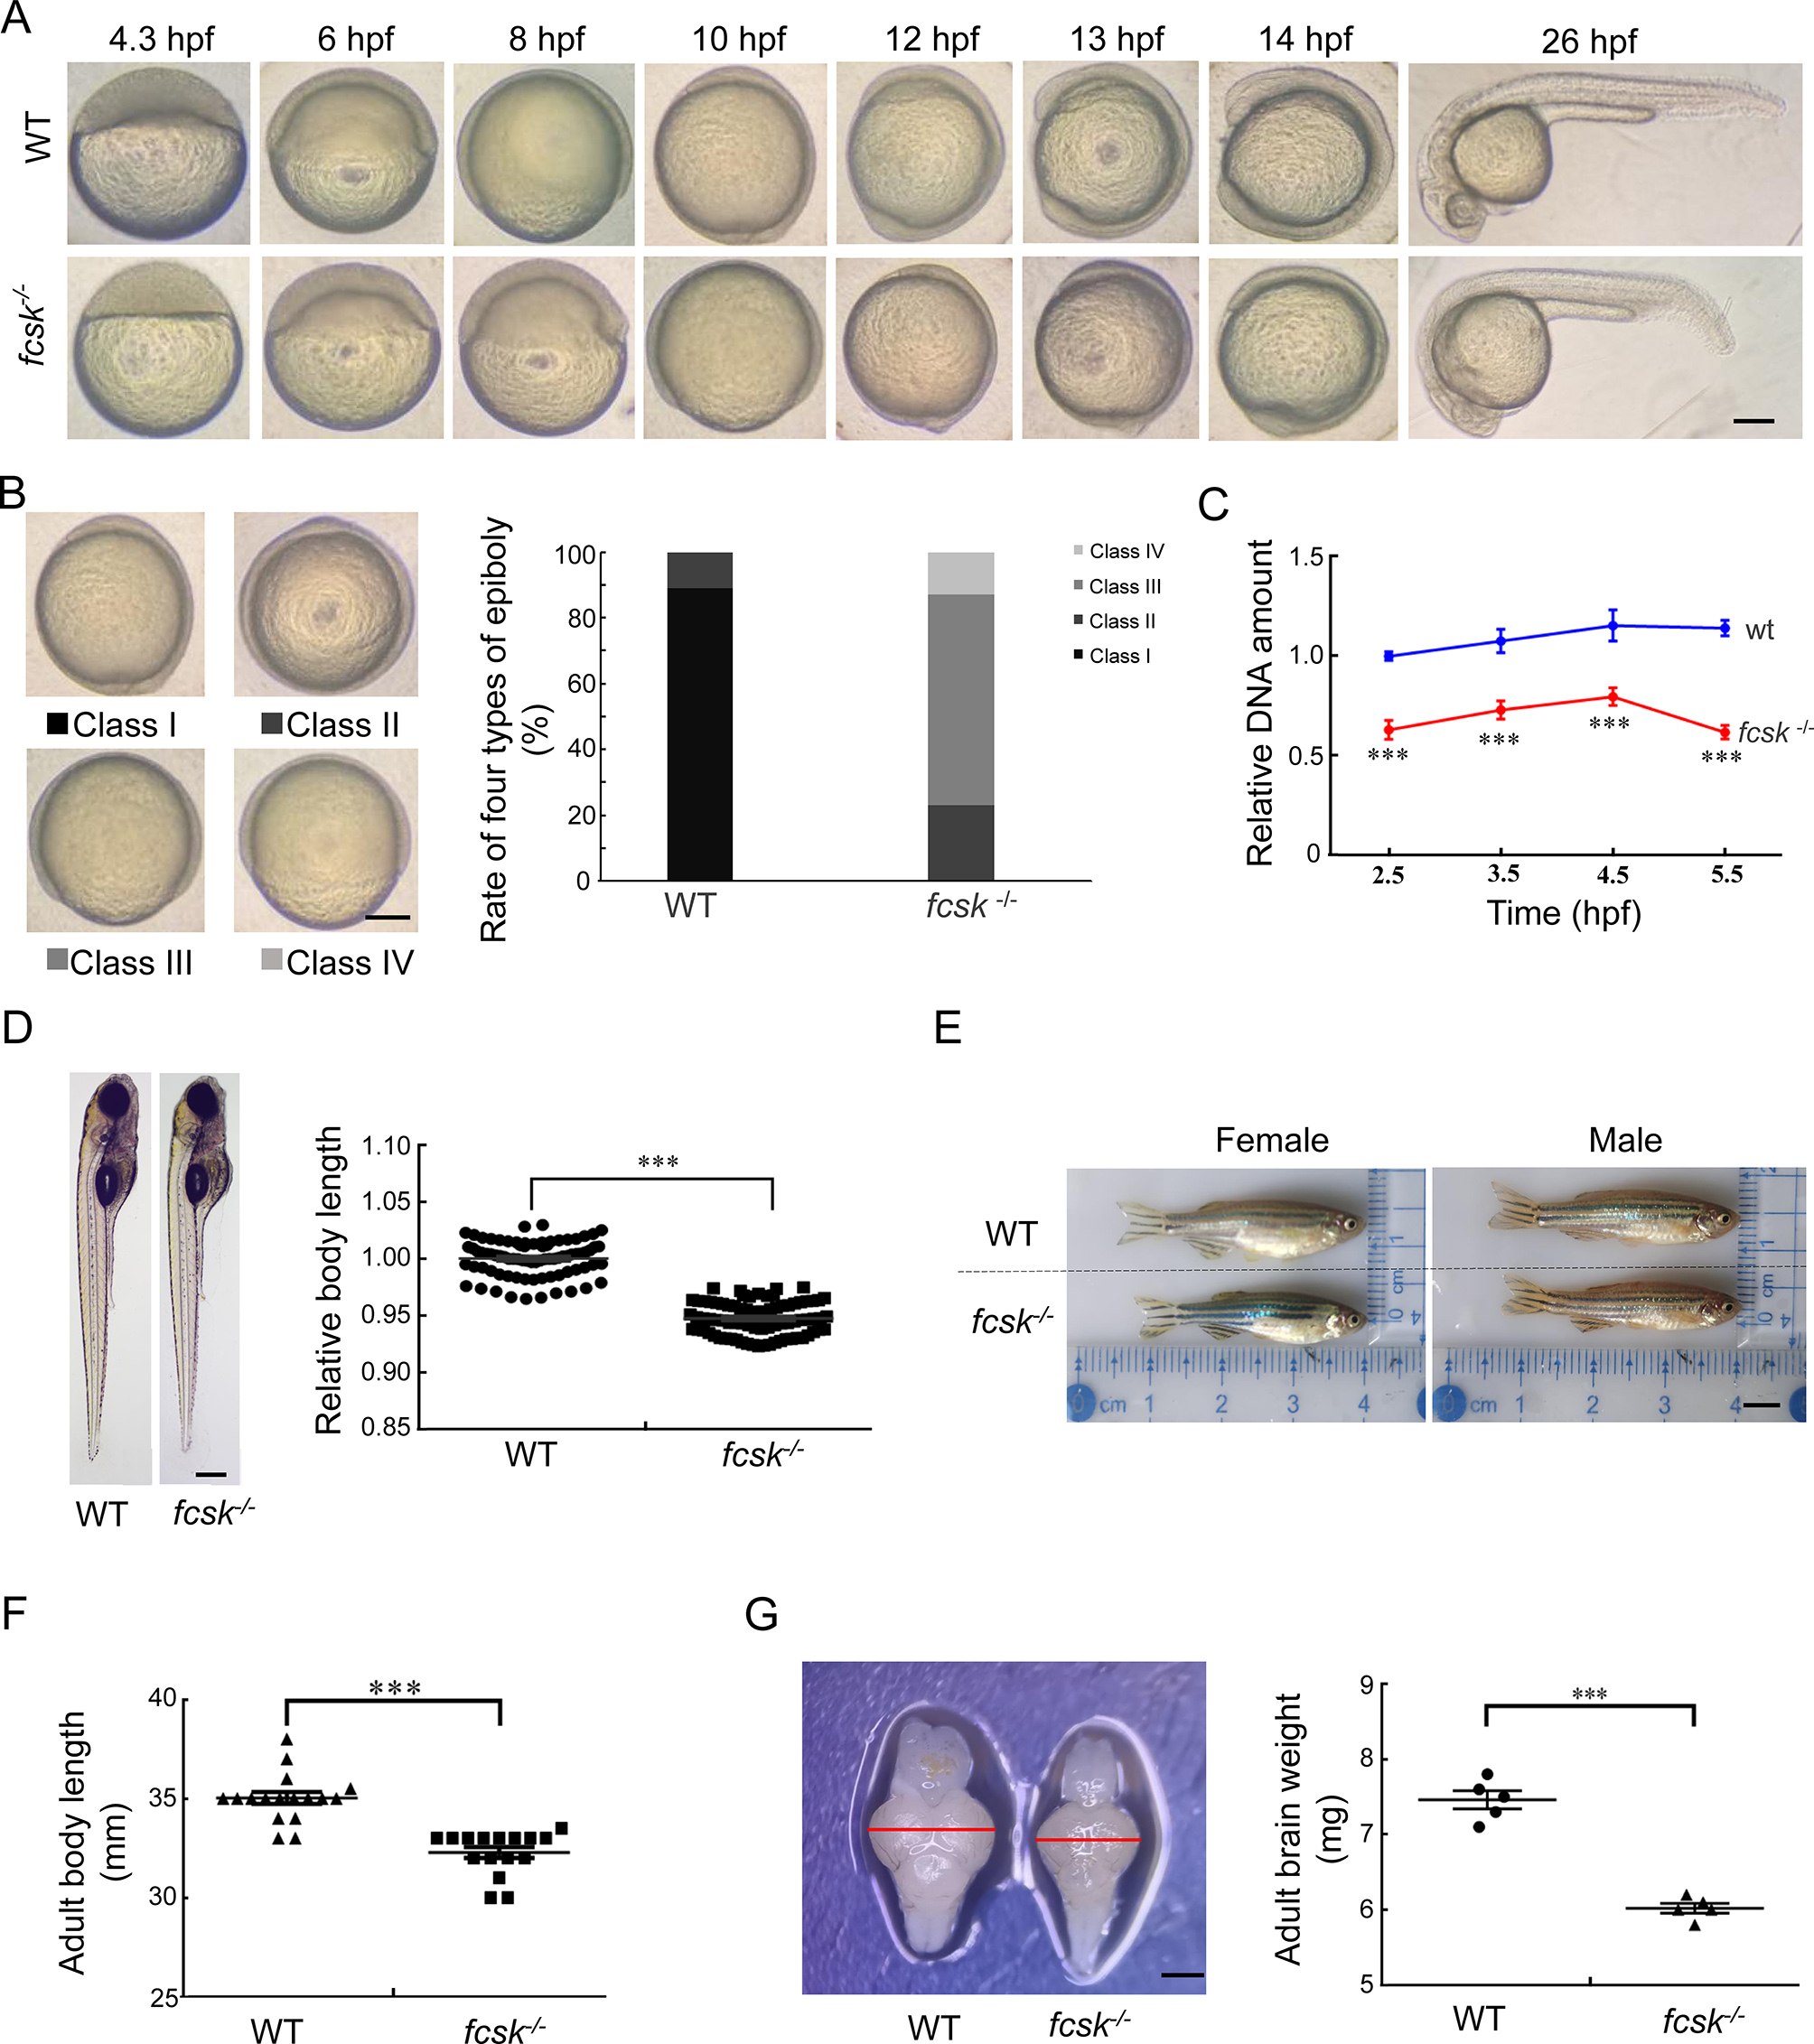
Fig. 2 Developmental retardation and brain atrophy in fcsk−/− zebrafish A: Representative images showing developmental delay in fcsk−/− embryos from 4.3 hpf to 26 hpf. hpf: Hours post-fertilization. Scale bar: 200 µm. B: Classification of epiboly progression at 10 hpf into four stages: Class I (epiboly completed, tail bud formed), Class II (epiboly completed, no tail bud formed), Class III (approximately 85% epiboly), and Class IV (approximately 60% epiboly). The proportion of these types was quantified in WT and fcsk−/− embryos (100 per group). Scale bar: 200 µm. C: Quantitative DNA content analysis in WT and fcsk−/− embryos pre- and post-MBT (2.5–5.5 hpf). Thirty embryos were collected at each time point under identical culture conditions. n=3. D: Body length comparison of WT and fcsk−/− larvae (5 dpf, 80 larvae per group). Scale bar: 200 µm. E: Body length comparison of WT and fcsk−/− adult zebrafish (4.5 mpf, female and male). mpf: Months post-fertilization. Scale bar: 0.5 cm. F: Statistical analysis of adult body length in 17 WT and 16 fcsk−/− zebrafish. G: Brain size (left) and weight (right) of fcsk−/− zebrafish (4.5 mpf). n=5. Scale bar: 200 µm. Mean±SEM. ***: P<0.001.