
Image
|
Figure Caption
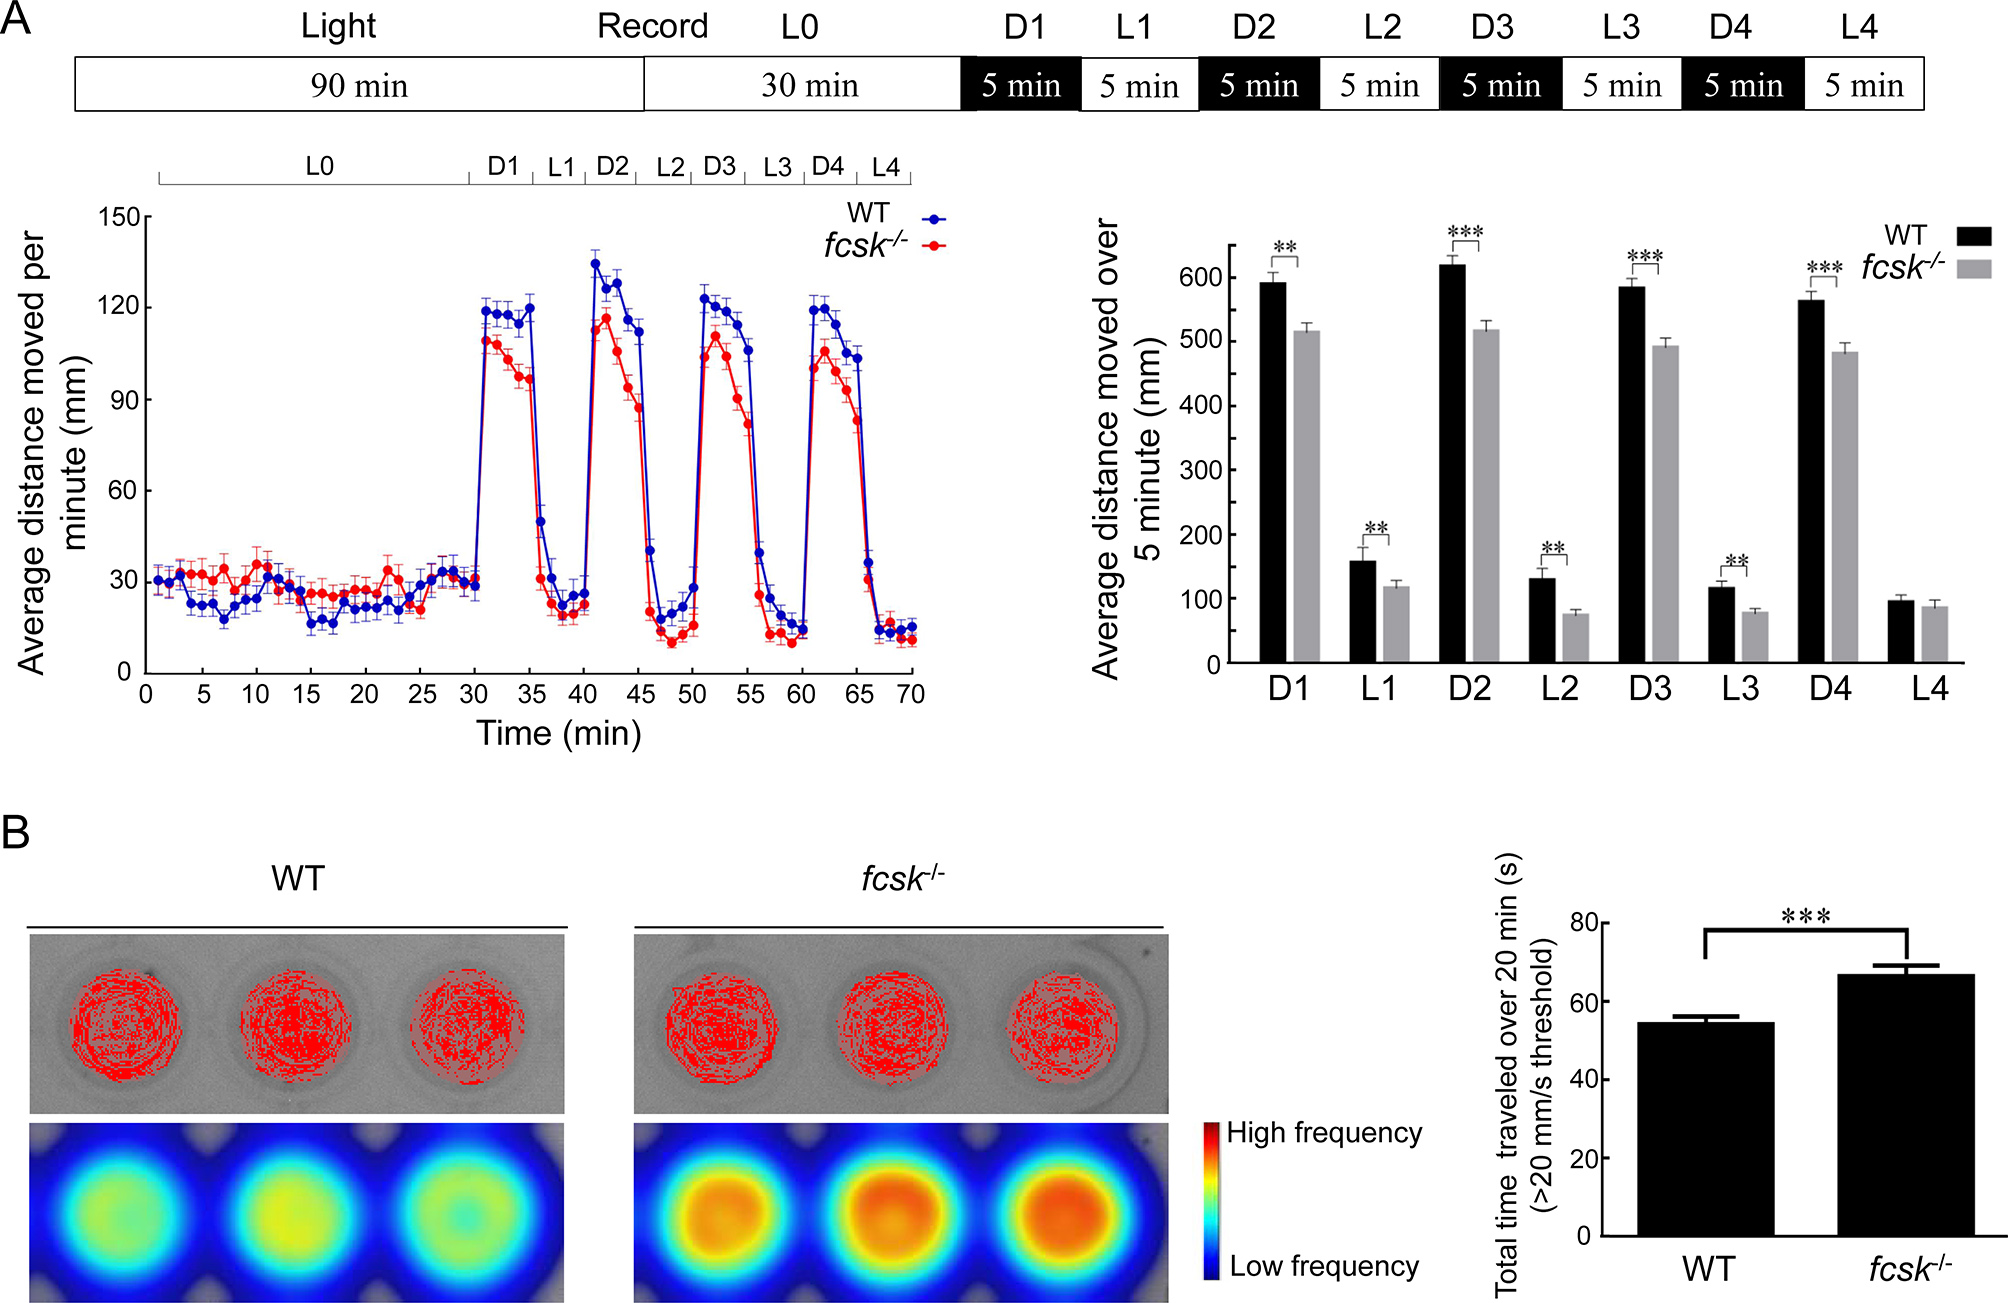
Fig. 3 Light-dark stimulation and PTZ induction seizure susceptibility in zebrafish larvae A: Experimental protocol for light-dark stimulation test. Average distance traveled by fcsk−/− larvae (6 dpf) under light and dark stimuli. n=48 per genotype. L: Light; D: Dark. B: Representative trajectory plots and heatmaps of PTZ-induced larvae (6 dpf), and duration of high-speed movements (>20 mm/s threshold) was significantly increased in fcsk−/− larvae compared to WT controls. n=48 per genotype. Mean±SEM. **: P<0.01; ***: P<0.001
Figure Data
Acknowledgments
This image is the copyrighted work of the attributed author or publisher, and
ZFIN has permission only to display this image to its users.
Additional permissions should be obtained from the applicable author or publisher of the image.
Full text @ Zool Res