
- Title
-
Brain monoamine changes modulate the corticotropin-releasing hormone receptor 1-mediated behavioural response to acute thermal stress in zebrafish larvae
- Authors
- Rajeswari, J.J., Gilbert, G.N.Y., Khalid, E., Vijayan, M.M.
- Source
- Full text @ Mol. Cell. Endocrinol.
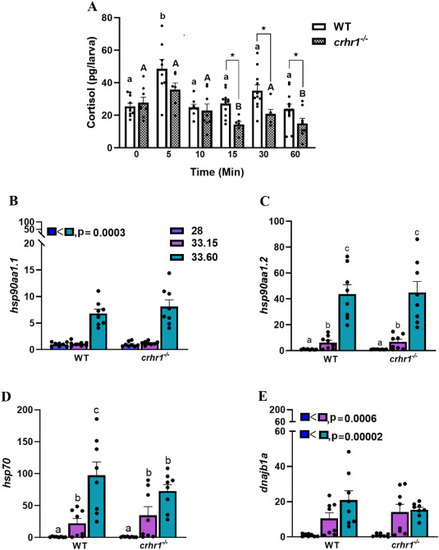
Loss of Crhr1 inhibits TS-induced cortisol response but not heat shock protein response: The top panel shows the whole-body cortisol levels among wildtype and crhr1−/− (A) at 28 °C (0 time-point) and at different time points (5–60 min) post-thermal stressor (33 °C). Bars represent mean + SEM with individual data points shown; bars with different letters (lowercase for WT and uppercase for crhr1−/−; only interaction but no main effect, P = 0.018) are significantly different (nonparametric two-way ANOVA; P = 0.018, n = 6–12, each a pool of 8–12 larvae). Asterisk (∗) represents significant differences between two groups (comparing each time point, P = 0.05). The bottom panel shows the transcript abundance of members of the heat shock protein (hsp) family, including hsp90aa1.1 (B, only main effect, no significant interaction, P = 0.0003), hsp90aa1.2 (C, only interaction, no main effect, P = 0.0006), hsp70.1 (D, only interaction, no main effect, P = 0.0002), and dnaja3b (E, only main effect (28 vs 33.15, P = 0.0006; 28 vs 33.60, P = 00002) and no significant interaction) in the wildtype and crhr1−/− larvae following exposure to 28 °C (28) for 60 min or 33 °C for 15min (33.15) or 60 min (33.60). Bars represent mean + SEM; bars with different letters for each gene are significantly different (nonparametric Two-way ANOVA, n = 8, each a pool of 6–12 larvae). The main effect is shown as an inset (Fig. 1B and E), while bars with different letter denotes significant interactions (between groups). |
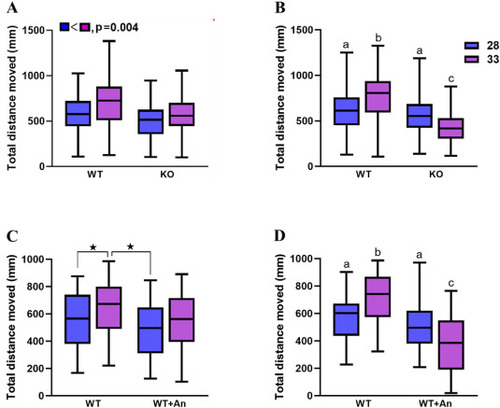
Loss of Crhr1 abolish the thermal stressor-induced hyperactivity: The top panel shows the total distance moved in the light by the wildtype (WT) and crhr1−/− larvae (KO) in response to 28 °C (28) or 33 °C (33) at 15 (A, only main effect, P = 0.004) or 60 min (B, significant interaction and no main effect, P = 0.0002). Boxes represent 1 SD above and below the mean of the data (n = 84–188, 4–8 trials with 24 larvae each), the line inside the box shows the median of the data, and the whiskers indicate the minimum and maximum of all the data; boxes with different letters are significantly different (nonparametric Two-way ANOVA). The bottom panel shows the total distance moved by the wildtype without (WT) and with antalarmin (WT + An) in response to 28 °C (28) or 33 °C (33) at 15 (C, only interaction, asterisk (∗) denotes significant difference between two group, P = 0.02) or 60 min (D, significant interaction but no main effect, P = 0.00003). Boxes represent 1 SD above and below the mean of the data (n = 34–90, 2–4 trials with 24 larvae each), the line inside the box shows the median of the data, and the whiskers indicate the minimum and maximum of all the data; The main effect is shown as an inset (Fig. 2A), while different letter or asterisk (∗) denotes significant interactions (between groups); boxes with different letters are significantly different (nonparametric Two-way ANOVA). PHENOTYPE:
|

Loss of Crhr1 reduces thigmotaxis in zebrafish larvae: The top panel shows the percent thigmotaxis in the wildtype (WT) and crhr1−/− larvae (KO) in response to 28 °C (28) or 33 °C (33) at 15 (A, significant interaction but no main effect, P = 0.0002) or 60 min (B, only significant interaction, P = 0.00002). Boxes represent 1 SD above and below the mean of the data (n = 92–188, 4–8 trials with 24 larvae each), the line inside the box shows the median of the data, and the whiskers indicate the minimum and maximum of all the data; boxes with different letters are significantly different (nonparametric Two-way ANOVA). The bottom panel shows the percent thigmotaxis in the wildtype without (WT) and with antalarmin (WT + An) in response to 28 °C (28) or 33 °C (33) at 15 (C, only significant interaction, P = 0.0004) or 60 min (D, no main effect but significant interaction, P = 0.0003). Boxes represent 1 SD above and below the mean of the data (n = 24–72, 1–3 trials with 24 larvae each), the line inside the box shows the median of the data, and the whiskers indicate the minimum and maximum of all the data; boxes with different letters are significantly different (nonparametric Two-way ANOVA). PHENOTYPE:
|
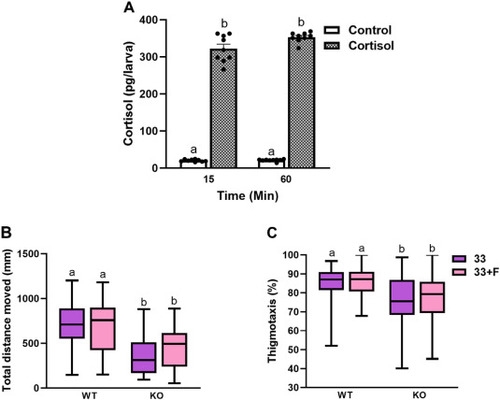
Cortisol treatment did not rescue the behavioral response to the thermal stressor in the crhr1−/− larvae: (A) Whole body cortisol levels among the WT fish following cortisol exposure for 15 and 60 min. Bars represent mean + SEM (n = 9, pool of 12 larvae per n); bars with different letters are significantly different (nonparametric Two -way ANOVA, no main effect but significant interaction, P = 0.024). The box plots shows the total distance moved in light (B, significant interaction but no main effect, P = 0.00022) and percent thigmotaxis (C, significant interaction but no main effect, P = 0.0002) exhibited by the wildtype (WT) and crhr1−/− larvae (KO) at 33 °C either without (33) or with cortisol (33+F) at 60 min. Cortisol (F) did not rescue the hypoactivity and the lower % thigmotaxis seen in the fish lacking Crhr1 at 60 min (See Fig. 2, Fig. 3 for more details). Boxes represent 1 SD above and below the mean of the data (n = 48–63, 2–3 trials with 24 larvae each), the line inside the box shows the median of the data, and the whiskers indicate the minimum and maximum of all the data; boxes with different letters are significantly different (nonparametric Two-way ANOVA). PHENOTYPE:
|
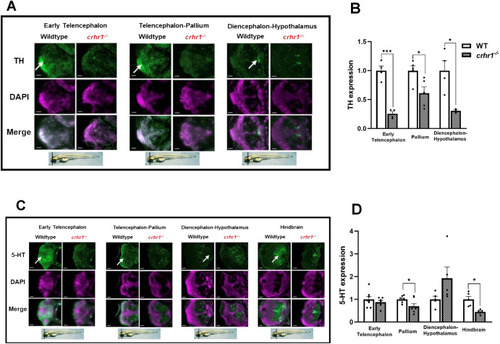
Loss of Crhr1 affects the monoamine system in zebrafish larvae: Representative immunohistochemistry (IHC) labelling (5A and 5C) of cryo-sectioned 4 dpf zebrafish wildtype and crhr1−/− larval brains for tyrosine hydroxylase (TH) (A) and serotonin (5-HT) (C), showing telencephalic (early telencephalon and telencephalon-pallium), diencephalon-hypothalamus, and hindbrain regions of interest (arrows) with altered levels of monoamine distribution between genotypes (scale bar = 50 μm). Zebrafish schematics underneath IHC images indicate relative location of representative brain section, adapted from ZFIN brain atlas (https://zfin.org/zf_info/anatomy.html) and related publication (Kimmel et al., 1995). Middle rows under each section (5A and 5C) represent respective sections stained with nuclear stain DAPI and the bottom rows represents merged images. The images were quantified and the relative intensity of TH (B) and 5-HT (D) expression in different brain regions are shown. Larval brain sections were analyzed in Fiji for the various regions of interest, and the integrated density values used to calculate fold change in intensity relative to wildtype. Bars represent means + SEM (n = 3–8), with values for individuals shown as data points. An asterisk indicates a statistically significant difference between genotypes (Student's t-test; ∗: P < 0.05, ∗∗: P < 0.01, ∗∗∗: P < 0.001). |
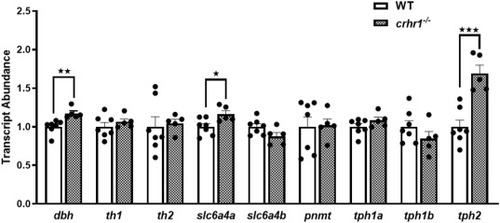
Relative transcript abundance of monoamine system genes: Graphs represent changes in transcript abundance of genes involved in monoamine biosynthesis and transport at 6 dpf in the wildtype (WT) and crhr1−/− larvae. Bars represent means + SEM (n = 5–7), with the individual data points shown. An asterisk indicates a statistically significant difference between genotypes (Student's t-test; ∗: P < 0.05, ∗∗: P < 0.01, ∗∗∗: P < 0.001); dbh: dopamine beta-hydroxylase; th1 and th2: tyrosine hydroxylase 1 and 2; slc6a4a and slc6a4b: serotonin transporter a and b; tph1a, tph1b, and tph2: tryptophan hydroxylase 1a, 1b and 2. |
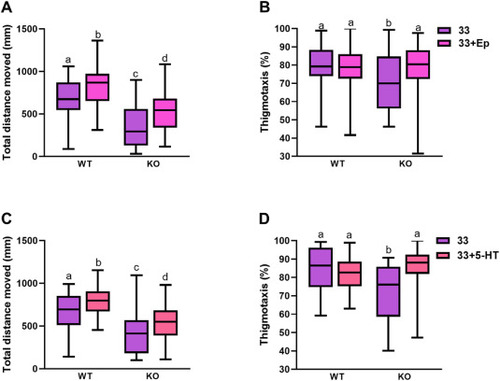
Epinephrine and 5-HT rescues the thermal stressor-mediated behavioral response in the crhr1−/− larvae: The box plots represent the total distance moved in light (A and C) and percent thigmotaxis (B and D) exhibited by the wildtype (WT) and crhr1−/− larvae (KO) at 33 °C without (33) and with either epinephrine (33+Ep) or serotonin (33+5-HT) at 60 min. Both epinephrine (Ep, Fig. A, significant interaction and no main effect, P = 0.00008) and serotonin (5-HT, Fig. C, significant interaction and no main effect, P = 0.00002) rescued the hypoactivity and the lower % thigmotaxis (Fig. B, significant interaction, P = 0.007 for Ep and Fig. D for 5-HT, significant interaction, P = 0.04) seen in fish lacking Crhr1 at 60 min (See Fig. 2, Fig. 3 for more details). Boxes represent 1 SD above and below the mean of the data (n = 40–120, 2–5 trials with 24 larvae each), the line inside the box shows the median of the data, and the whiskers indicate the minimum and maximum of all the data; boxes with different letters are significantly different (nonparametric Two-way ANOVA). PHENOTYPE:
|
Reprinted from Molecular and Cellular Endocrinology, , Rajeswari, J.J., Gilbert, G.N.Y., Khalid, E., Vijayan, M.M., Brain monoamine changes modulate the corticotropin-releasing hormone receptor 1-mediated behavioural response to acute thermal stress in zebrafish larvae, 112494112494, Copyright (2025) with permission from Elsevier. Full text @ Mol. Cell. Endocrinol.