
- Title
-
ROS regulates circadian rhythms by modulating Ezh2 interactions with clock proteins
- Authors
- Zhang, H.Y., Li, K.Y., Wang, Y.L., Wei, C.J., Gao, Y.X., Ren-Zhou, ., Zhong, Y.B., Yin, Z.J., Ren, D.L.
- Source
- Full text @ Redox Biol.

Induction of oxidative stress and reactive oxygen species (ROS) in zebrafish larvae by 2 mM H₂O₂ Zebrafish larvae at 6 h postfertilization (hpf) were exposed to a concentration gradient of H₂O₂ to investigate oxidative stress responses. (n = 20) (A). Body length of zebrafish larvae at 96 hpf. (B). Survival curve of zebrafish larvae from 6 hpf to 5 days postfertilization (dpf). (C). Spontaneous tail-beating frequency of zebrafish larvae within 1 min at 96 hpf. (D). Heartbeat frequency of zebrafish larvae measured within 20 s at 48 hpf and 72 hpf. (E). The expression of the nrf2 gene in 5 dpf zebrafish larvae after treatment with a gradient of H₂O₂ and DPI for 3 h was analysed via RT‒qPCR. (F). ROS are detected by DCFH-DA, which reacts with ROS to produce the fluorescent compound DCF. (G). Zebrafish larvae at 5 dpf (n = 20) were treated with 2 mM H₂O₂ and DPI for 3 h, followed by DCFH-DA staining for 1 h. The fluorescence intensity was observed via a fluorescence microscope and analysed via ImageJ software. (Statistical significance was determined via t tests, with significance levels indicated as follows: ns, p > 0.05; ∗, p < 0.05; ∗∗, p < 0.01; ∗∗∗, p < 0.001; ∗∗∗∗, p < 0.0001.) |

Effects of reactive oxygen species on behavioral rhythms and locomotion patterns in zebrafish larvae The effects of H₂O₂ and DPI treatments on the locomotor activity of 4 dpf zebrafish larvae were evaluated under light‒dark (LD) and dark‒dark (DD) conditions. (A) Locomotor activity of 4 dpf zebrafish larvae (n = 16) treated with H₂O₂ and DPI continuously monitored for 3 days under LD conditions. Line plots show the average distance moved every 10 min per group, with shaded areas representing confidence intervals. (B) Total distance moved over 3 days across different treatment groups. (C) Comparison of average distances moved under LD and DD conditions. (D) Proportion of time spent in three locomotion modes (inaduration, duration, and larduration) under the LD and DD conditions. (E) Locomotor activity of zebrafish larvae (n = 16) treated with H₂O₂ and DPI and monitored for 3 days under DD conditions. Line plots show the average distance moved every 10 min per group, with shaded areas representing confidence intervals. (F) Polynomial fitting analysis of average locomotor distances under DD conditions. (G) Average locomotor distances over 3 days in different treatment groups. (H) Scatter plots of the mean phase analysis across groups. (I) Scatter plots of the mean period analysis showing locomotor cycles in different groups. (J) Phase ranking of locomotor activity across groups over 3 days. (K) Proportions of total activity time spent in three locomotion modes (inaduration, duration, and larduration) over 3 days. Statistical significance was determined via t tests, with significance levels indicated as follows: ns, p > 0.05; ∗∗, p < 0.01. (LD: light‒dark; DD: dark‒dark). |

ROS induce dysregulation of core circadian clock genes in zebrafish larvae Under LD (light‒dark) and DD (dark‒dark) conditions, 5 dpf zebrafish larvae (n = 30) were treated with different drugs for 3 h, and RNA samples were collected every 4 h for RT‒qPCR analysis of core circadian clock gene expression. (A–D) Effects of ROS treatment on core circadian clock genes (clock1a, bmal1b, per1b, and per3) in zebrafish larvae under LD conditions. (E–H) Effects of ROS treatment on core circadian clock genes under DD conditions. JTK cycle analysis was performed to assess rhythmicity, amplitude, period, and phase changes. Bar scatter plots display period and amplitude data, and pie charts illustrate phase shifts. Each group of experiments was repeated three times. Statistical significance was analysed at each time point via t tests, with significance levels denoted as follows: ns, p > 0.05; ∗, p < 0.05; ∗∗, p < 0.01; ∗∗∗, p < 0.001; ∗∗∗∗, p < 0.0001. |

ROS levels affect circadian rhythms in U2OS cells. (A) A DCFH-DA fluorescent probe was used to detect intracellular ROS levels in U2OS cells treated with H₂O₂ and DPI, with grayscale images used to locate the cells. (B) Fluorescence intensity levels were quantified via ImageJ (n = 15). (C) CCK8 assays revealed no significant effect of H₂O₂ or DPI treatment on U2OS cell viability (n = 3). (D) RT‒qPCR was used to measure the expression levels of core circadian clock genes (CLOCK, BMAL1, PER1, PER2) at ZT1 and ZT15 after H₂O₂ and DPI treatment. (E–G) WB analysis revealed that H₂O₂ decreased the CLOCK and BMAL protein levels, whereas DPI increased them; protein band intensities were quantified via ImageJ as the ratio of the target protein to actin. (H) Bioluminescence analysis of U2OS::PER2-dLuc in response to H₂O₂ and DPI treatment. (I–K) Analysis of the U2OS::PER2-dLuc bioluminescence period, phase, and amplitude revealed that H₂O₂ shortened the period, increased the amplitude, and induced phase shifts, whereas DPI had the opposite effects. (L) Bioluminescence analysis of U2OS::BMAL1-dLuc in response to H₂O₂ and DPI treatment. (M–O) Analysis of the U2OS::BMAL1-dLuc bioluminescence period, phase, and amplitude revealed that H₂O₂ shortened the period, increased the amplitude, and induced phase shifts, whereas DPI had the opposite effects. Each group of experiments was repeated three times. Statistical significance was analysed at each time point via t tests, with significance levels denoted as follows: ns, p > 0.05; ∗, p < 0.05; ∗∗, p < 0.01; ∗∗∗, p < 0.001; ∗∗∗∗, p < 0.0001. |
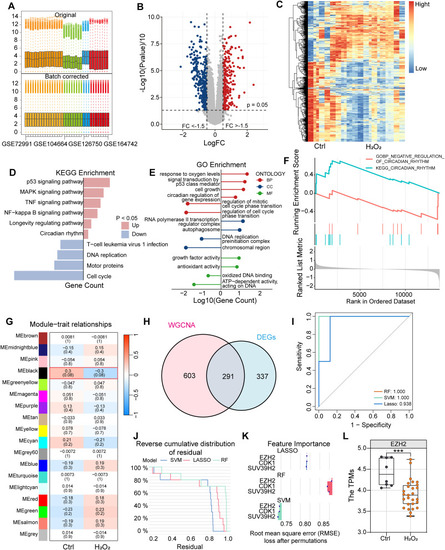
Machine learning analysis reveals EZH2 as a key gene in oxidative stress-regulated circadian rhythm (A) After multiple GEO datasets were merged, batch effects were removed via the Combat package, with boxplots showing data distributions before and after batch effect removal. (B–C) Volcano plots and heatmaps displaying the distribution of upregulated and downregulated genes in the dataset. (D–E) KEGG and GO enrichment analysis results of differentially expressed genes (DEGs). (F) GSEA enrichment analysis using the Misdb circadian gene set as the background. (G) WGCNA weighted gene coexpression network analysis divided the dataset into multiple gene modules, with the black module showing the highest correlation to the circadian clock. (H) Venn diagram showing the intersection of WGCNA module genes and DEGs. (I–J) Residual plots from the RF, LASSO, and SVM machine learning methods revealing the reliability of the three methods. (K) Gene importance ranking based on machine learning models. (L) Box-and-scatter plots of TPM values of the EZH2 gene across different groups in the dataset, with a t-test (∗∗∗, p < 0.001) indicating significant differences between the two groups. |
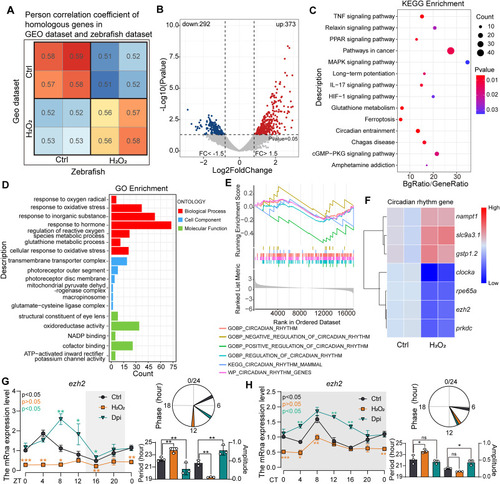
Zebrafish Transcriptome Validation of Machine Learning Results on ROS-Mediated Circadian Rhythm Regulation (A) GEO datasets were randomly divided into two groups, and their average expression levels were compared with those of zebrafish transcriptome samples through Pearson correlation coefficient analysis, which revealed similar expression patterns between the zebrafish and GEO datasets. (B) Volcano plot illustrating the distribution of upregulated and downregulated genes in the zebrafish transcriptome. (C–D) KEGG and GO enrichment analysis results of differentially expressed genes (DEGs). (E) GSEA enrichment analysis using the zebrafish circadian clock gene set from the Misdb database as the background gene set. (F) Heatmap showing the expression levels of core circadian clock-related genes among the DEGs. (G–H) Under LD and DD conditions, zebrafish larvae at 5 dpf were treated with different drugs for 3 h, with samples collected every 4 h (30 larvae per sample). RT‒qPCR was performed to analyse the expression levels of ezh2, and the experiments were repeated three times. JTK-Cycle was used to analyse mRNA rhythmicity, period, phase, and amplitude. Two-way ANOVA and multiple t tests were performed for statistical analysis (∗, p < 0.05; ∗∗, p < 0.01; ∗∗∗, p < 0.001). |

Downregulation of ezh2 reduces zebrafish behavioural activity (A) Under LD conditions, the locomotor activity of ezh2−/− mutant zebrafish and ezh2 morpholino-treated 4 dpf larvae (n = 16) was monitored for 3 consecutive days. The line plot represents the average swimming distance per 10 min over 3 days for each group, with shaded areas showing confidence intervals. (B) Average swimming distance over 3 days for different groups, analysed via t tests for statistical significance. (C–D) Average daytime and nighttime swimming distances over 3 days for different groups, with t-test significance analysis. (E) Proportions of duration, duration, and duration of total activity over 3 days; reduced ezh2 increased the proportion of nonstationary activity. (F) Under DD conditions, the locomotor activity of ezh2−/− mutant zebrafish and ezh2 morpholino-treated 4 dpf larvae (n = 16) was monitored for 3 consecutive days. The line plot represents the average swimming distance per 10 min, with shaded areas indicating confidence intervals. (G) Polynomial fitting of the swimming distance curves for the different groups. (H) Average swimming distance over 3 days for different groups, with t-test significance analysis. (I) JTK-Cycle periodicity analysis of DD data revealed significant increases in period, reduced amplitude expression, and delayed phase shift in both groups. (t-test significance: ns, p > 0.05; ∗, p < 0.05; ∗∗, p < 0.01; ∗∗∗, p < 0.001; ∗∗∗∗, p < 0.0001). |
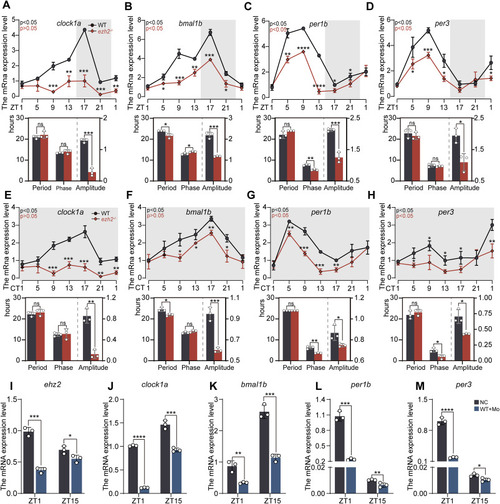
Downregulation of EZH2 disrupts the rhythmic expression of circadian clock genes in zebrafish Under LD and DD conditions, RNA samples were collected every 4 h from 5 dpf wild-type (WT) and ezh2−/− mutant zebrafish larvae (n = 30) for RT‒qPCR analysis. (A–D) Under LD conditions, RT‒qPCR was performed on the core clock genes (clock1a, bmal1b, per1b, per3) of 5 dpf wild-type (WT) and ezh2−/− mutant zebrafish larvae. The experiments were repeated three times. (E–H) RNA samples were collected from 30 wild-type (WT) and 5 dpf ezh2−/− mutant zebrafish larvae under DD conditions every 4 h. RT‒qPCR was conducted on core clock genes (clock1a, bmal1b, per1b, and per3), and the experiments were repeated three times. (I–M) Zebrafish embryos were microinjected with morphine, and the mRNA levels of ezh2 and core clock genes (clock1a, bmal1b, per1b, and per3) were measured at the ZT1 and ZT15 time points in 5 dpf larvae. The experiments were repeated three times. JTK-Cycle was used to analyse periodicity, amplitude, cycle, and phase. Bar scatter plots show cycle and amplitude data, and pie charts depict phase shifts; statistical significance was analysed for each time point (t-test: ns, p > 0.05; ∗, p < 0.05; ∗∗, p < 0.01; ∗∗∗, p < 0.001; ∗∗∗∗, p < 0.0001). |
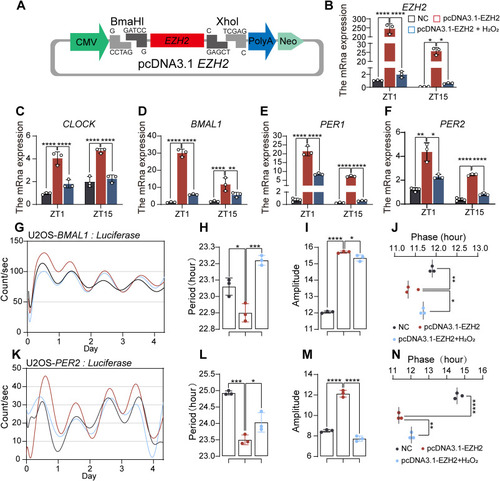
Overexpression of EZH2 Inhibits the Effects of ROS on the Circadian Clock (A) Construction of an EZH2 overexpression plasmid by inserting the EZH2 sequence downstream of the CMV promoter. (B–F) Following transfection with the EZH2 overexpression plasmid and 3-h H₂O₂ treatment, the mRNA levels of EZH2 and core clock genes (CLOCK, BMAL1, PER1, PER2) were measured. Each group was repeated three times, and t tests were used for significance analysis. The results indicated that ezh2 overexpression significantly increased the expression of core clock genes, whereas H₂O₂ treatment suppressed the increase in EZH2 expression and reduced core clock gene levels. (G) Comparison of U2OS::BMAL1-dLuc luminescence among three groups: EZH2 overexpression, EZH2 overexpression with H₂O₂ treatment, and the nonoverexpression control. (H–J) Analysis of the U2OS::BMAL1-dLuc luminescence cycle, phase, and amplitude revealed that H₂O₂ disrupted the effect of EZH2 overexpression, which normally shortened the cycle, increased the amplitude, and shifted the phase. (K) Comparison of U2OS::PER2-dLuc luminescence among the same three groups. (L–N) Analysis of the U2OS::PER2-dLuc luminescence cycle, phase, and amplitude revealed that H₂O₂ also disrupted the effects of EZH2 overexpression on U2OS::PER2-dLuc cycle shortening, amplitude increase, and phase shift. The experiments were repeated three times. (t tests were used for statistical analysis: ∗, p < 0.05; ∗∗, p < 0.01; ∗∗∗, p < 0.001; ∗∗∗∗, p < 0.0001). |

Overexpression of EZH2 Inhibits the Effects of ROS on the Circadian Clock (A) Construction of an EZH2 overexpression plasmid by inserting the EZH2 sequence downstream of the CMV promoter. (B–F) Following transfection with the EZH2 overexpression plasmid and 3-h H₂O₂ treatment, the mRNA levels of EZH2 and core clock genes (CLOCK, BMAL1, PER1, PER2) were measured. Each group was repeated three times, and t tests were used for significance analysis. The results indicated that ezh2 overexpression significantly increased the expression of core clock genes, whereas H₂O₂ treatment suppressed the increase in EZH2 expression and reduced core clock gene levels. (G) Comparison of U2OS::BMAL1-dLuc luminescence among three groups: EZH2 overexpression, EZH2 overexpression with H₂O₂ treatment, and the nonoverexpression control. (H–J) Analysis of the U2OS::BMAL1-dLuc luminescence cycle, phase, and amplitude revealed that H₂O₂ disrupted the effect of EZH2 overexpression, which normally shortened the cycle, increased the amplitude, and shifted the phase. (K) Comparison of U2OS::PER2-dLuc luminescence among the same three groups. (L–N) Analysis of the U2OS::PER2-dLuc luminescence cycle, phase, and amplitude revealed that H₂O₂ also disrupted the effects of EZH2 overexpression on U2OS::PER2-dLuc cycle shortening, amplitude increase, and phase shift. The experiments were repeated three times. (t tests were used for statistical analysis: ∗, p < 0.05; ∗∗, p < 0.01; ∗∗∗, p < 0.001; ∗∗∗∗, p < 0.0001). |

Diagram of the mechanism by which ROS regulates circadian rhythms by regulating the interaction of Ezh2 with clock proteins. |