
|
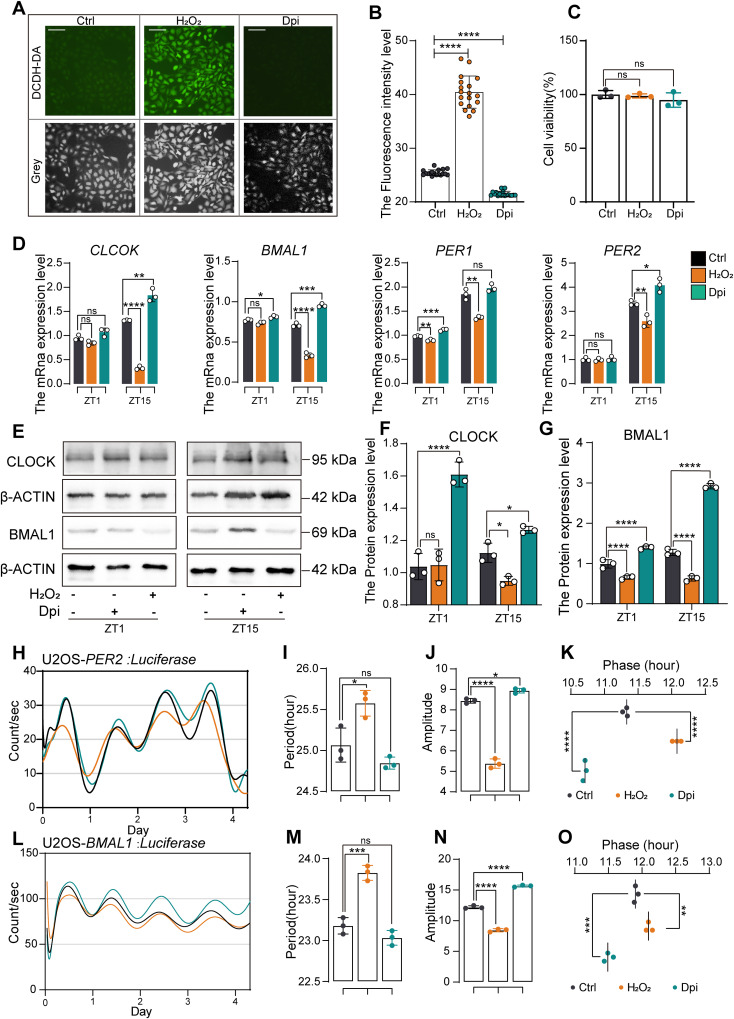
Fig. 4 ROS levels affect circadian rhythms in U2OS cells. (A) A DCFH-DA fluorescent probe was used to detect intracellular ROS levels in U2OS cells treated with H₂O₂ and DPI, with grayscale images used to locate the cells. (B) Fluorescence intensity levels were quantified via ImageJ (n = 15). (C) CCK8 assays revealed no significant effect of H₂O₂ or DPI treatment on U2OS cell viability (n = 3). (D) RT‒qPCR was used to measure the expression levels of core circadian clock genes (CLOCK, BMAL1, PER1, PER2) at ZT1 and ZT15 after H₂O₂ and DPI treatment. (E–G) WB analysis revealed that H₂O₂ decreased the CLOCK and BMAL protein levels, whereas DPI increased them; protein band intensities were quantified via ImageJ as the ratio of the target protein to actin. (H) Bioluminescence analysis of U2OS::PER2-dLuc in response to H₂O₂ and DPI treatment. (I–K) Analysis of the U2OS::PER2-dLuc bioluminescence period, phase, and amplitude revealed that H₂O₂ shortened the period, increased the amplitude, and induced phase shifts, whereas DPI had the opposite effects. (L) Bioluminescence analysis of U2OS::BMAL1-dLuc in response to H₂O₂ and DPI treatment. (M–O) Analysis of the U2OS::BMAL1-dLuc bioluminescence period, phase, and amplitude revealed that H₂O₂ shortened the period, increased the amplitude, and induced phase shifts, whereas DPI had the opposite effects. Each group of experiments was repeated three times. Statistical significance was analysed at each time point via t tests, with significance levels denoted as follows: ns, p > 0.05; ∗, p < 0.05; ∗∗, p < 0.01; ∗∗∗, p < 0.001; ∗∗∗∗, p < 0.0001.