
- Title
-
Human Oncostatin M deficiency underlies an inherited severe bone marrow failure syndrome
- Authors
- Garrigue, A., Kermasson, L., Susini, S., Fert, I., Mahony, C.B., Sadek, H., Luce, S., Chouteau, M., Cavazzana, M., Six, E., Le Bousse-Kerdilès, M.C., Anginot, A., Souraud, J.B., Cormier-Daire, V., Willems, M., Sirvent, A., Russello, J., Callebaut, I., André, I., Bertrand, J.Y., Lagresle-Peyrou, C., Revy, P.
- Source
- Full text @ Journal of Clin. Invest.
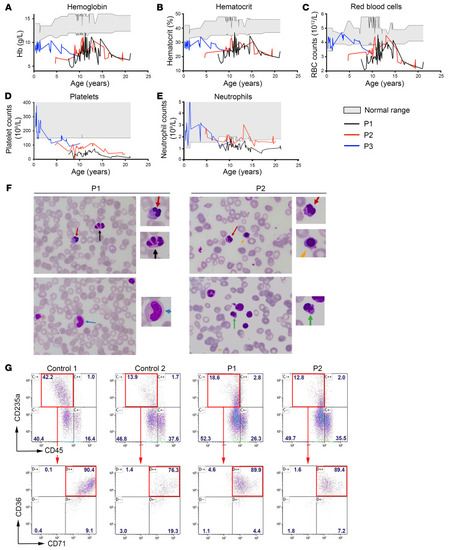
Evolution of hematologic values in the 3 patients, cytological analysis of bone marrow smears, and in vitro erythrocyte differentiation. Variation of hemoglobin (g/dL) ( |
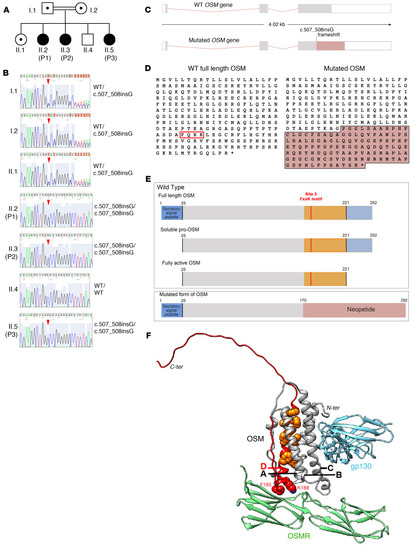
Identification of a homozygous OSM mutation in the patients. ( |
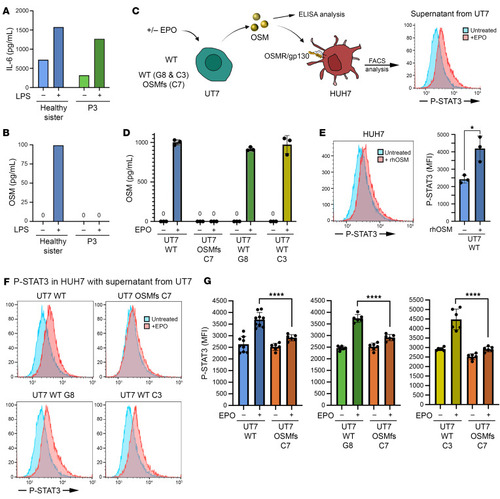
Functional consequence of the OSM mutation. ( |
( EXPRESSION / LABELING:
PHENOTYPE:
|
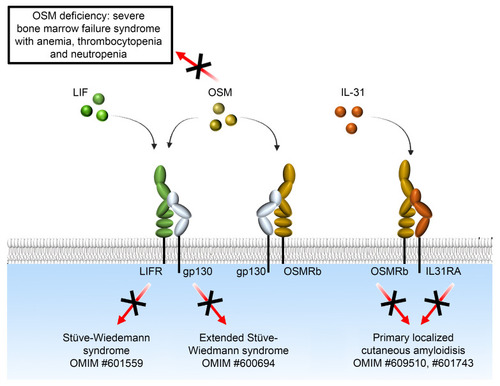
OSM deficiency as a novel inherited bone marrow failure syndrome. Schematic representation of the complexity of the signaling pathways of OSM and OSMRb and the diseases associated with their deficiency in humans. The OMIM number for each disease is shown. |

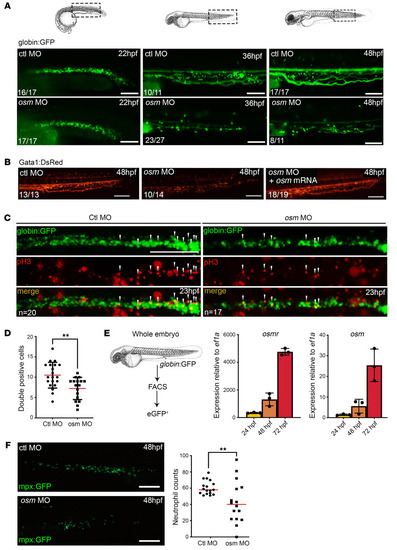
ZFIN is incorporating published figure images and captions as part of an ongoing project. Figures from some publications have not yet been curated, or are not available for display because of copyright restrictions. PHENOTYPE:
|
|
ZFIN is incorporating published figure images and captions as part of an ongoing project. Figures from some publications have not yet been curated, or are not available for display because of copyright restrictions. |
|
ZFIN is incorporating published figure images and captions as part of an ongoing project. Figures from some publications have not yet been curated, or are not available for display because of copyright restrictions. PHENOTYPE:
|