IMAGE

Figure 3

ID
ZDB-IMAGE-250318-40
Source
Figures for Garrigue et al., 2025
Image
Figure Caption

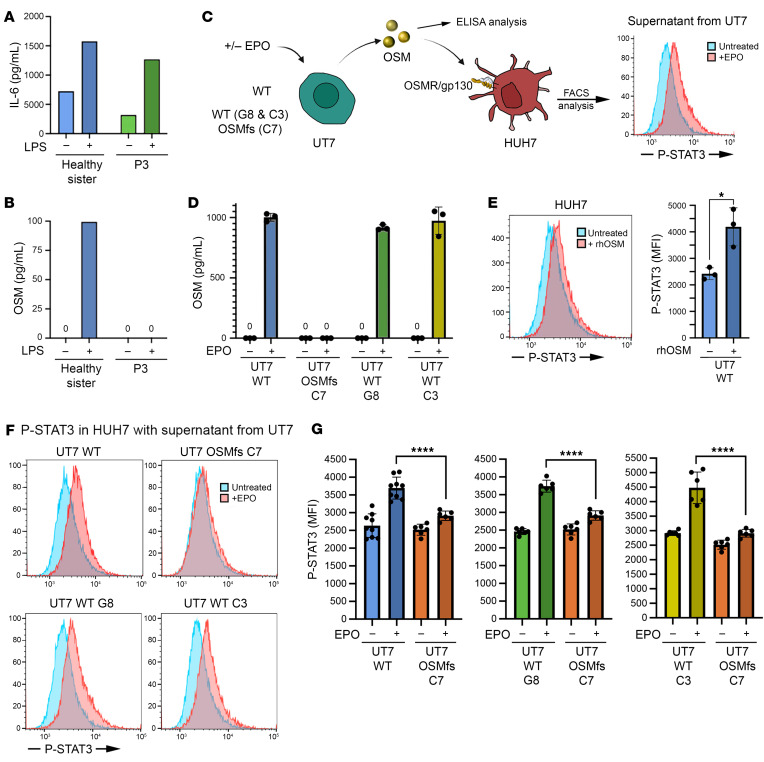
Figure 3 Functional consequence of the OSM mutation.

(A) IL-6 concentration measured by ELISA in supernatants from LPS-activated monocytes from the healthy sister and P3. (B) OSM concentration measured by ELISA in supernatants from LPS-activated monocytes from the healthy sister and P3. (C) Schematic representation of the protocol used to measure OSM production by ELISA in supernatant from EPO-activated UT7 cells and its signaling detection in HUH7. OSM induces STAT3 phosphorylation (pSTAT3) in HUH7 as detected by FACS. (D) OSM concentration measured by ELISA in supernatants from EPO-activated WT UT7 cell line, the UT7 clone carrying the frameshift in the OSM sequence (clone C7), and 2 WT UT7 clones (C3 and G8). (E) Left: Representative FACS result demonstrating that rhOSM, used as positive control, induced a shift in STAT3 phosphorylation signal in HUH7 cells. Right: Quantitative analysis of 3 independent replicates. Statistics derived from unpaired t tests with α = 0.05. *P < 0.05. (F) Representative FACS results of p-STAT3 detection in HUH7 cells in the presence of indicated supernatants. (G) p-STAT3 induction obtained with the supernatants from EPO-activated WT UT7 cell line, the UT7 clone carrying the frameshift in the OSM sequence (clone C7), and 2 WT UT7 clones (C3 and G8). Quantitative analysis of 3 independent replicates. Statistics derived from unpaired t tests with α = 0.05. ****P < 0.0001.

Acknowledgments
This image is the copyrighted work of the attributed author or publisher, and ZFIN has permission only to display this image to its users. Additional permissions should be obtained from the applicable author or publisher of the image. Full text @ Journal of Clin. Invest.