
- Title
-
Toll-like receptor adaptor protein TIRAP has specialized roles in signaling, metabolic control and leukocyte migration upon wounding in zebrafish larvae
- Authors
- Liu, L., Hu, W., Kerman, F.D., Spaink, H.P.
- Source
- Full text @ Int. J. Biol. Sci.
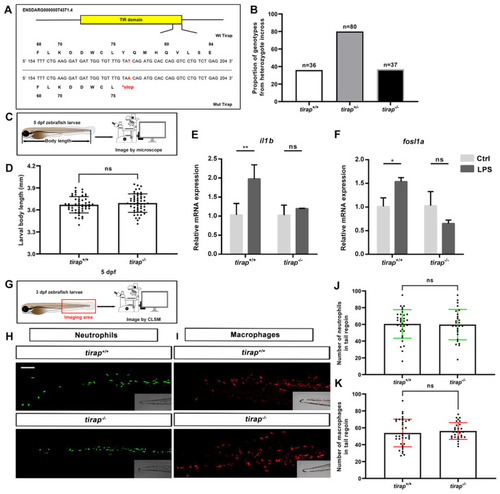
Characterization of |
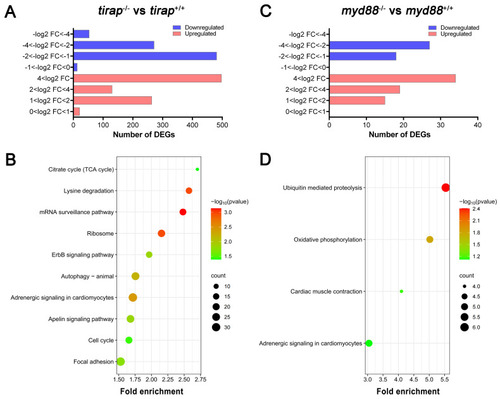
Transcriptomic profiles of |
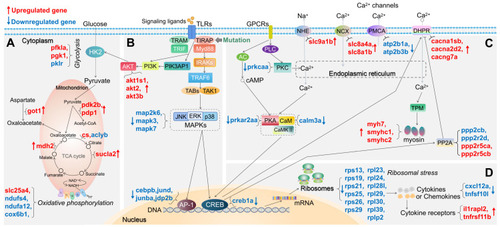
Schematic diagram of significantly differentially expressed genes (DEGs) in the representative pathways in |
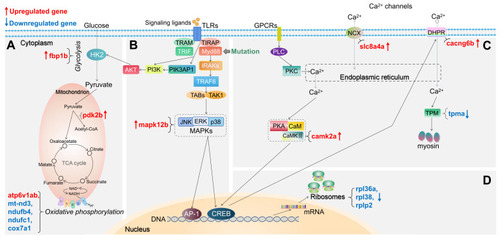
Schematic diagram of significantly differentially expressed genes (DEGs) in the representative pathways in myd88 mutant zebrafish larvae compared to the wild type controls. (A) Glycolysis and gluconeogenesis, TCA cycle and oxidative phosphorylation related pathways. (B) TLR-associated signaling pathways. (C) Calcium regulation-related pathways. (D) Ribosome-associated pathway. The significance was established as padj value less than 0.05. Red arrows represent significantly upregulated DEGs, blue arrows represent significantly downregulated DEGs. The link between TIRAP and PIK3AP1 refers to Luo, |
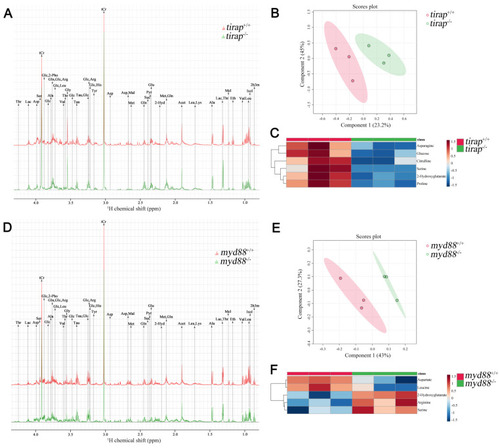
Metabolic profiles of |
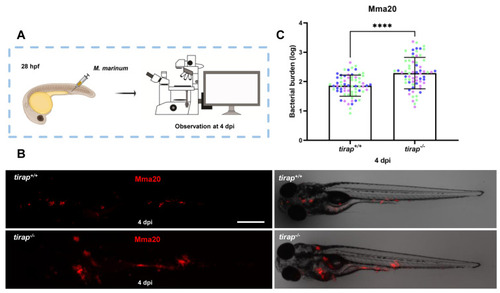
Quantification of bacterial burden after |
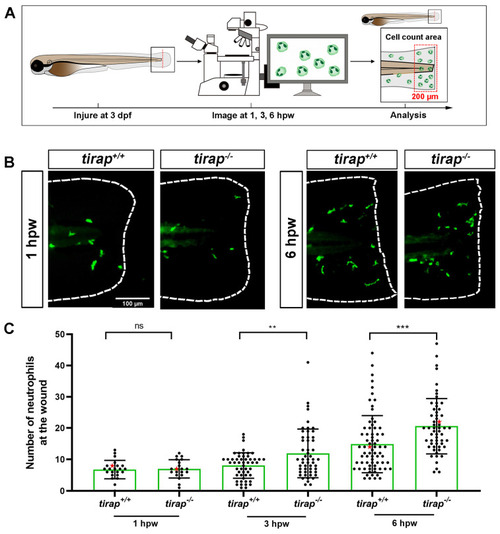
The number of recruited neutrophils upon tail wounding in zebrafish larvae. (A) Schematic representation of experiment. The wounded zebrafish larvae were imaged at designated times 1 hour post wounding (hpw), 3 hpw and 6 hpw. (B) Representative images of |

Quantification of neutrophil behaviour upon tail wounding in zebrafish larvae. (A) Schematic representation of experiment. (B) Representative image of neutrophil migration at frame 120 (3 hpw) (C-D) Quantification of neutrophil migratory capability of 3 dpf |
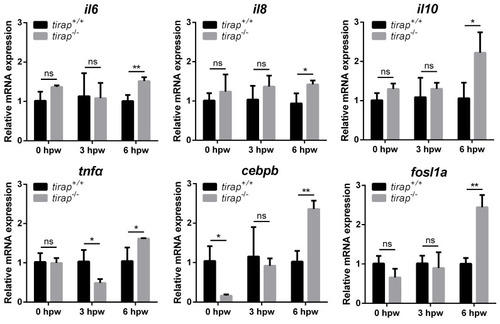
Relative expression of immune-related genes upon tail wounding in |

Graphical summary of |