IMAGE

Figure 5

ID
ZDB-IMAGE-250109-225
Source
Figures for Liu et al., 2025
Image
Figure Caption

Figure 5

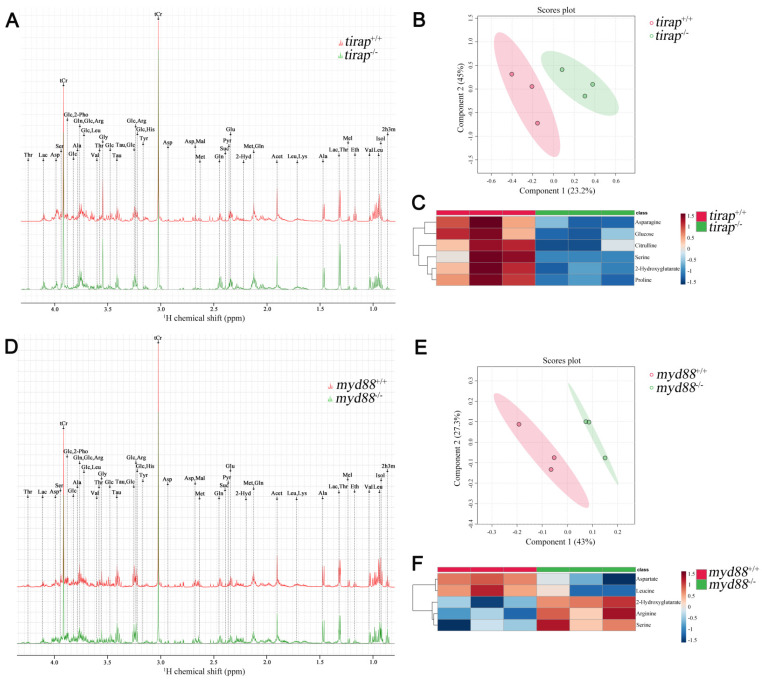
Metabolic profiles of tirap mutant and myd88 mutant zebrafish larvae measured by 1H NMR and analysis of PLS-DA and heat map. (A) The representative one-dimensional 1H NMR spectra of tirap wild type and mutant zebrafish larvae measured by NMR spectrometry. Spectra from chemical shift 0.8 to 4.3 were assigned to specific metabolites. (B) PLS-DA analysis of tirap wild type and mutant groups. n = 3, each replicate represents 120 pooled larvae. (C) Heat map analysis of significantly altered metabolites detected in tirap mutants (P < 0.05). n = 3, each replicate represents 120 pooled larvae. (D) The representative one-dimensional 1H NMR spectra of myd88 wild type and mutant zebrafish larvae measured by NMR spectrometry. Spectra from chemical shift 0.8 to 4.3 were assigned to specific metabolites. (E) PLS-DA analysis of myd88 wild type and mutant groups. n = 3, each replicate represents 120 pooled larvae. (F) Heat map analysis of significantly altered metabolites detected in myd88 mutants (P < 0.05). Thr threonine, Lac lactate, Asp aspartate, Ser Serine, tCr total creatine (creatine + phosphocreatine), Glc Glucose, 2-Pho 2-Phosphoglycerate, Ala alanine, Gln glutamine, Arg arginine, Leu leucine, Val valine, Gly glycine, Tau taurine, His Histidine, Tyr tyrosine, Mal Malate, Met Methionine, Suc Succinate, Pyr Pyruvate, Glu glutamate, Acet Acetate, Lys lysine, Mel Melatonin, Eth Ethanol, Isol Isoleucine, 2h3m 2-Hydroxy-3-methylvalerate, 2-Hyd 2-Hydroxyglutarate.

Acknowledgments
This image is the copyrighted work of the attributed author or publisher, and ZFIN has permission only to display this image to its users. Additional permissions should be obtained from the applicable author or publisher of the image. Full text @ Int. J. Biol. Sci.