
|
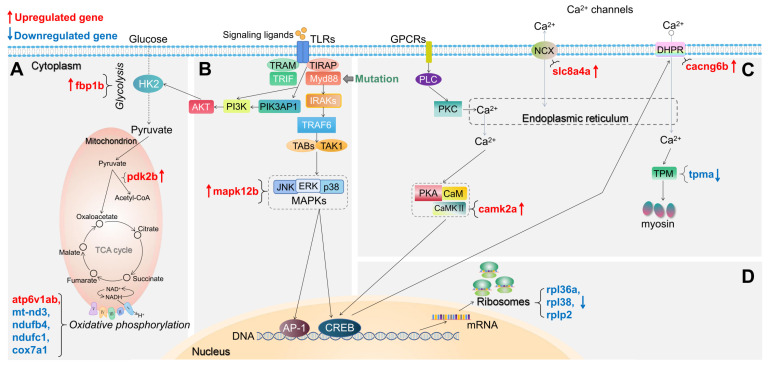
Figure 4
Schematic diagram of significantly differentially expressed genes (DEGs) in the representative pathways in myd88 mutant zebrafish larvae compared to the wild type controls. (A) Glycolysis and gluconeogenesis, TCA cycle and oxidative phosphorylation related pathways. (B) TLR-associated signaling pathways. (C) Calcium regulation-related pathways. (D) Ribosome-associated pathway. The significance was established as padj value less than 0.05. Red arrows represent significantly upregulated DEGs, blue arrows represent significantly downregulated DEGs. The link between TIRAP and PIK3AP1 refers to Luo,