IMAGE

Figure 2

ID
ZDB-IMAGE-250109-222
Source
Figures for Liu et al., 2025
Image
Figure Caption

Figure 2

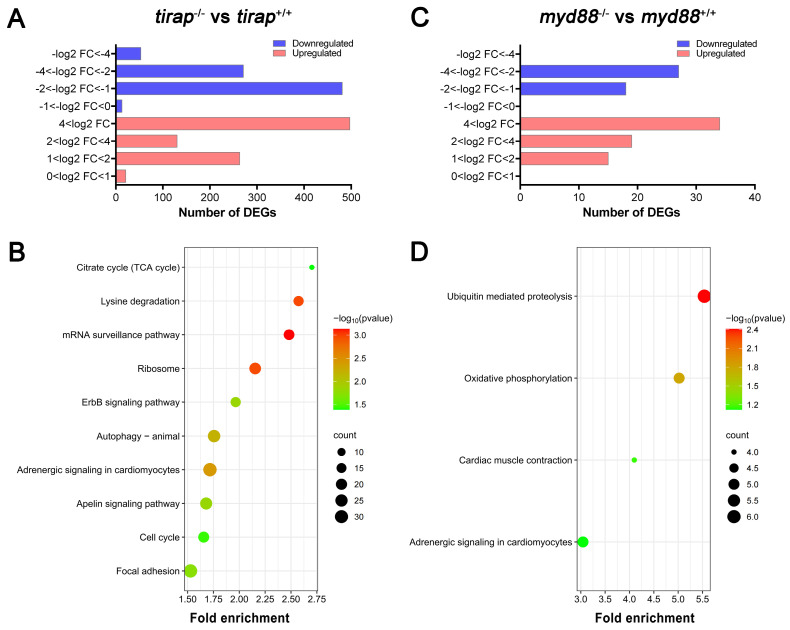
Transcriptomic profiles of tirap mutant and myd88 mutant zebrafish larvae measured by RNAseq. (A) Overview of the distribution of differentially expressed genes (DEGs) log2 fold change in tirap-/- versus tirap+/+ zebrafish larvae. (B) Overview of the distribution of DEGs log2 fold change in myd88-/- versus myd88+/+ zebrafish larvae. DEGs were assessed by padj value less than 0.05. Down-regulated gene sets are shown in blue, and up-regulated gene sets are shown in red. (C) KEGG pathway enrichment analysis of tirap-/- versus tirap+/+. (D) KEGG pathway enrichment analysis of myd88-/- versus myd88+/+. Significantly enriched KEGG pathway terms for DEGs of tirap-/- versus tirap+/+ groups were determined by using the hypergeometric test/Fisher's exact test, with a threshold of p value < 0.05, which were adjusted using the Benjamini and Hochbery FDR correction. For myd88-/- versus myd88+/+ group, significantly enriched KEGG pathway terms for DEGs were determined by using the hypergeometric test/Fisher's exact test, with a threshold of p value < 0.1.

Acknowledgments
This image is the copyrighted work of the attributed author or publisher, and ZFIN has permission only to display this image to its users. Additional permissions should be obtained from the applicable author or publisher of the image. Full text @ Int. J. Biol. Sci.