FIGURE SUMMARY
Title

Carbonic anhydrase inhibition ameliorates tau toxicity via enhanced tau secretion

Authors
Lopez, A., Siddiqi, F.H., Villeneuve, J., Ureshino, R.P., Jeon, H.Y., Koulousakis, P., Keeling, S., McEwan, W.A., Fleming, A., Rubinsztein, D.C.
Source
Full text @ Nat. Chem. Biol.

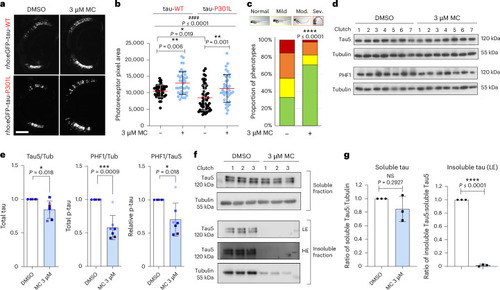
Methocarbamol ameliorates tau-induced toxicity and reduces hyperphosphorylated and insoluble tau levels in zebrafish models.

a, Representative images of retinal tissue from rho:eGFP–tau-WT and rho:eGFP–tau-P301L fish showing increased rod survival after treatment with 3 μM methocarbamol (MC). Scale bar, 50 μm. b, Quantification of fluorescent photoreceptor area (as shown in a) following treatment with 3 μM methocarbamol. Drug treatment increased the pixel area of eGFP–tau+ photoreceptors (n = minimum of 38 eyes per condition; data are shown as mean ± s.d.). Data were analyzed by one-way ANOVA, ####P ≤ 0.0001, followed by Tukey’s multiple comparisons test with the following significance values: **P ≤ 0.01 versus DMSO (–), *P ≤ 0.01 for tau-WT (–) versus tau-P301L (–). c, Proportion of morphological abnormalities in fish with pan-neuronal expression of Dendra–tau-A152T after treatment with 3 μM methocarbamol. Phenotypes were ranked as normal (green), mild (yellow), moderate (Mod.; orange) and severe (Sev.; red) according to the severity of deformities (representative images are shown above the graph). Methocarbamol reduced the proportion of fish in the severe category while increasing the proportion of normal fish compared with DMSO-treated siblings (–); n = 13 clutches with a minimum of 30 fish per group; ****P ≤ 0.0001 versus DMSO (–). Data were analyzed by χ2 test. d,e, Images (d) and quantification (e) of western blots showing levels of total (Tau5) and hyperphosphorylated tau (PHF1) in fish with pan-neuronal expression of Dendra–tau-A152T after treatment with 3 μM methocarbamol. Methocarbamol reduces the levels of total tau (Tau5/tubulin), total phospho-tau (p-tau; PHF1/tubulin) and relative amounts of phosphorylated tau (that is, the normalized ratio of (PHF1/tubulin)/(Tau5/tubulin) represented as PHF1/tau); n = 7 independent clutches with 10 fish each ± s.d.; *P ≤ 0.05 versus DMSO; ***P ≤ 0.001 versus DMSO. Data were analyzed by two-tailed one-sample t-test; Tub, tubulin. f,g, Images (f) and quantification (g) of western blots for the sarkosyl-soluble and sarkosyl-insoluble fractions of tau in fish 6 d.p.f. with pan-neuronal expression of Dendra–tau-A152T treated with either DMSO or 3 μM methocarbamol. Graphs show mean ratios (±s.d.) of soluble tau versus tubulin and insoluble tau versus soluble tau normalized to the mean DMSO value. Three independent clutches per condition were used; n = 50 fish per group; ****P ≤ 0.0001 versus DMSO; NS, not significant. Data were analyzed by two-tailed one-sample t-test.

Source data

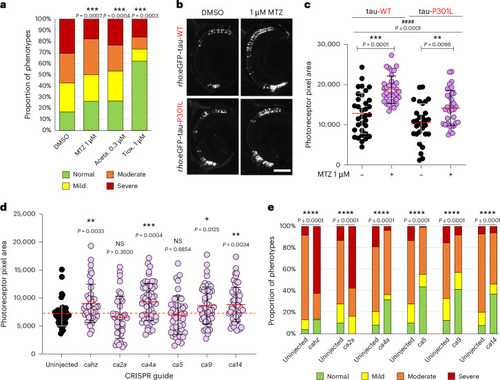
The rescuing effect of methocarbamol relies on its primary pharmacological target, the CA family.

a, Proportion of morphological abnormalities in fish with pan-neuronal expression of Dendra–tau-A152T after treatment with 1 μM methazolamide (MTZ), 0.3 μM acetazolamide (Aceta.) or 1 μM tioxolone (Tiox.). Treatment with all CA inhibitors resulted in phenotypic rescue compared with DMSO-treated siblings (n = 6 clutches with ≥20 fish in each group; ***P ≤ 0.001 versus DMSO. Data were analyzed by χ2 test. b,c, Representative images of the retina of transgenic rho:eGFP–tau-WT and rho:eGFP–tau-P301L fish (b) and quantification of the pixel area of eGFP–tau+ photoreceptors following treatment with 1 μM methazolamide (c), showing an increase in eGFP–tau+ photoreceptors after treatment with methazolamide relative to DMSO-treated siblings (n ≥ 32 eyes per condition; the graph shows mean ± s.d.). Data were analyzed by one-way ANOVA, ####P≤ 0.0001, followed by Tukey’s multiple comparisons test with the following significance values: ***P ≤ 0.001 versus DMSO (–) for wild-type tau and **P ≤ 0.01 versus DMSO (–) for tau-P301L. Scale bar, 50 μm. d, Quantification of the pixel area of eGFP–tau+ rod photoreceptors following CRISPR injection. CRISPR targeting of cahz, ca4a, ca9 and ca14 increased the area of rod photoreceptors relative to uninjected siblings (for representative images, see Extended Data Fig. 4e; n ≥ 39 eyes per condition; data are shown as mean ± s.d.); *P ≤ 0.05, **P ≤ 0.01 and ***P ≤ 0.001 versus uninjected. Data were analyzed by two-tailed unpaired t-test. e, Proportion of morphological abnormalities in fish with pan-neuronal expression of Dendra–tau-A152T following CRISPR-based knockdown of CA isoforms. Genetic inhibition of ca4a, ca5, ca9 and ca14 increased the proportion of normal phenotypes, whereas CRISPR injection targeting cahz and ca2 worsened the morphological defects compared with uninjected siblings (n = 3 clutches for toxic conditions (cahz and ca2) and n ≥ 4 clutches with a minimum of 30 fish per clutch for ca4a, ca5, ca9 and ca14); ****P ≤ 0.0001 versus uninjected. Data were analyzed by χ2 test.

Source data

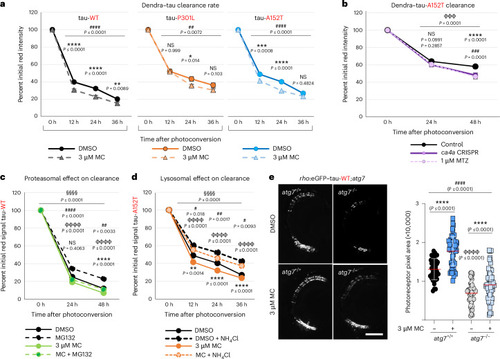
CA inhibition increases the clearance rate of tau without affecting proteasomal or autophagic degradation in vivo.

a, Clearance kinetics of Dendra–tau in fish expressing tau-WT, tau-P301L or tau-A152T treated with DMSO (continuous lines) or 3 μM methocarbamol (dashed lines). All Dendra–tau forms cleared at a significantly faster rate following methocarbamol treatment than following treatment with DMSO (n ≥49 neurons per group; data are shown as mean ± s.d.). Data were analyzed by two-way ANOVA (##P ≤ 0.01 and ####P ≤ 0.0001) followed by Sidak’s multiple comparisons, *P ≤ 0.05, **P ≤ 0.01, ***P ≤ 0.001 and ****P ≤ 0.0001 versus DMSO. b, Clearance kinetics of Dendra–tau-A152T in fish treated with 1 μM methazolamide or injected with CRISPR guide RNA targeting ca4a compared with uninjected fish (treated with DMSO). Treatment with methazolamide or ca4a genetic inhibition increased the clearance of Dendra–tau-A152T (n ≥ 57 neurons per group; data are shown as mean ± s.d.). Data were analyzed by one-way ANOVA, ɸɸɸP ≤ 0.001, followed by Sidak’s multiple comparisons test with the following significance values: ****P ≤ 0.0001 versus control for ca4a CRISPR and ###P ≤ 0.001 versus control for methazolamide. c, Clearance kinetics of Dendra–tau-WT in fish treated with 3 μM methocarbamol with or without the proteasome inhibitor MG132 (10 μM). MG132 delayed the clearance of tau-WT, whereas methocarbamol increased tau clearance. However, tau-WT clearance in the presence of methocarbamol + MG132 was significantly higher than that observed in the presence of MG132 alone, suggesting that methocarbamol can accelerate tau clearance when proteasomal degradation is inhibited (n ≥ 69 neurons per group; data are shown as mean ± s.d.). Data were analyzed by one-way ANOVA, §§§§P ≤ 0.0001, followed by Sidak’s multiple comparisons test with the following significance values: ##P < 0.01 and ####P < 0.0001 for DMSO versus methocarbamol; ɸɸɸɸP ≤ 0.0001 for DMSO versus MG132; ****P ≤ 0.0001 for methocarbamol versus methocarbamol + MG132. d, Effect of methocarbamol on lysosomal tau clearance kinetics of Dendra–tau-A152T in the presence or absence of 10 μM NH4Cl. NH4Cl blocks lysosomal acidification and delays the clearance of tau-A152T, whereas 3 μM methocarbamol accelerates it. Tau is cleared more rapidly when methocarbamol is combined with NH4Cl than with NH4Cl alone, suggesting that methocarbamol-improved tau clearance kinetics do not entirely depend on lysosomal degradation (n ≥ 60 neurons per group; data are shown as mean ± s.d.). Data were analyzed by one-way ANOVA, §§§§P ≤ 0.0001, followed by Sidak’s multiple comparisons test with the following significance values: **P ≤ 0.01 and ****P ≤ 0.0001 for DMSO versus 3 μM methocarbamol; #P < 0.05 and ##P < 0.01 for DMSO + NH4Cl versus methocarbamol + NH4Cl; ɸɸɸɸP ≤ 0.0001 for DMSO versus DMSO + NH4Cl. e, Representative images and quantification of photoreceptors in autophagy-competent or autophagy-null rho:eGFP–tau-WT fish. Autophagy abrogation accelerated the loss of rod photoreceptors, whereas 3 μM methocarbamol rescued retinal degeneration in both atg7+/+ and Atg7-deficient (atg7−/−) fish to the same extent; scale bar, 50 μm (n ≥ 39 eyes per condition; data are shown as mean ± s.d.). Data were analyzed by one-way ANOVA, ####P ≤ 0.0001, followed by Tukey’s multiple comparisons test with the following significance values: ****P ≤ 0.0001 versus DMSO (–) and ɸɸɸɸP ≤ 0.0001 versus atg7+/+.

Source data

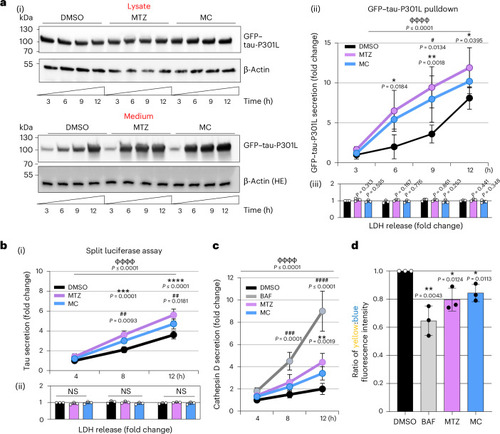
CA inhibition induces the secretion of tau via lysosomal exocytosis.

a, GFP-Trap pulldown of extracellular tau from the medium of SH-SY5Y cells expressing GFP–tau-P301L after 24-h induction with 0.2 µg ml–1 doxycycline. Treatment with 30 μM methazolamide or 30 μM methocarbamol increased extracellular tau compared with medium from DMSO-treated cells. Immunoblots (i) show tau levels in cell lysates and immunoprecipitated tau from medium over 12 h (β-actin was used as the loading control for lysates). The relative quantification of the tau secretion rate (ii) is shown on the right. Values were normalized to DMSO at t = 3 h (data are shown as the mean of n = 3 biological replicates ± s.d.); *P ≤ 0.05 for methazolamide versus DMSO; *P ≤ 0.05 and **P ≤ 0.01 for methazolamide versus DMSO; #P ≤ 0.05 for methocarbamol versus DMSO. Data were analyzed by two-way ANOVA followed by Tukey’s multiple comparisons test (ɸɸɸɸP ≤ 0.0001). Quantification of LDH release was monitored from each medium fraction (iii; data are shown as the mean of n = 3 biological replicates ± s.d.). Data were analyzed by two-tailed Student’s t-test. b, Split luciferase complementation assay in stable SH-SY5Y cells expressing HiBit-tagged tau incubated in complete medium in the presence of DMSO, 30 μM methazolamide or 30 μM methocarbamol over 12 h. Drug treatment increased extracellular tau compared with treatment with DMSO (i) without affecting LDH release (ii). Values were normalized to the control sample (DMSO) at t = 4 h (i; data are shown as the mean of n = 3 biological replicates ± s.d.). Data were analyzed by two-way ANOVA (ɸɸɸɸP ≤ 0.0001), followed by Tukey’s multiple comparisons test, ***P ≤ 0.001 and ****P ≤ 0.0001 for methazolamide versus DMSO, ##P ≤ 0.01 for methocarbamol versus DMSO. For ii, the bars indicate LDH release (data are shown as the mean of n = 3 biological replicates ± s.d.). Data were analyzed by two-tailed Student’s t-test. c, Levels of cathepsin D in cell medium determined by ELISA after incubation of SH-SY5Y cells in complete medium with DMSO, 100 μM bafilomycin A1 (BAF), 30 μM methazolamide or 30 μM methocarbamol over 12 h. Values were normalized to DMSO at t = 4 h (data are shown as the mean of n = 3 biological replicates ± s.d.); **P ≤ 0.01 for methazolamide versus DMSO; ###P ≤ 0.001 and ####P ≤ 0.0001 for bafilomycin A1 versus DMSO. Data were analyzed by two-way ANOVA followed by Tukey’s multiple comparisons test (ɸɸɸɸP ≤ 0.0001). d, Lysosomal pH was analyzed in SH-SY5Y cells following incubation in complete medium with DMSO, 100 μM bafilomycin A1, 30 μM methazolamide or 30 μM methocarbamol for 6 h using LysoSensor DND-160. A reduced yellow-to-blue ratio is indicative of increased pH. Values were normalized to DMSO (data are shown as the mean of n = 3 biological replicates ± s.d.); *P ≤ 0.05 and **P ≤ 0.01 versus DMSO. Data were analyzed by two-tailed Student’s t-test; Ctl, control.

Source data

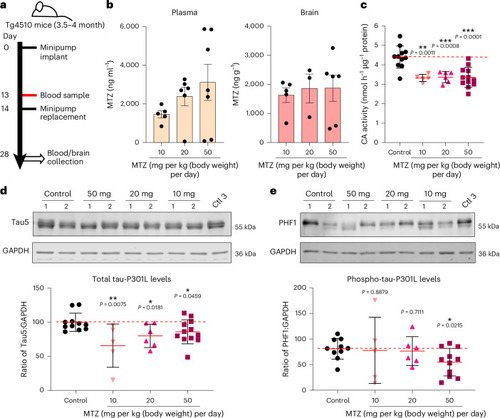
CA inhibition reduces total and phospho-tau levels in Tg4510 tau transgenic mice.

a, Subcutaneous methazolamide-loaded osmotic minipumps (ALZET Model 2002) were implanted in 3.5- to 4-month-old Tg4510 mice (both sexes) for 28 days. Pumps were replaced once at day 14. To determine the human equivalent dose, three different doses of methazolamide (10, 20 and 50 mg per kg (body weight) per day) were used. At day 13, a blood sample was collected before implanting the second minipump. Terminal blood and brain samples were collected at day 28 (n = 5 for 10 mg, n = 6 for 20 mg, n = 12 for 50 mg and n = 11 for vehicle control mice). b, Graph representing the concentration of methazolamide in the plasma (ng ml–1) and brains (ng g−1) of Tg4510 transgenic mice treated with 10, 20 and 50 mg per kg (body weight) methazolamide for 28 days by subcutaneous osmotic minipumps (n = 5 mice per group (minimum); data are shown as mean ± s.e.m.). c, Effect of treatment with 10, 20 or 50 mg per kg (body weight) per day methazolamide on brain CA activity as determined by colorimetric enzymatic assay. Methazolamide reduced CA activity at all doses and had a prolonged effect, reducing CA activity in the brains of wild-type mice from 5 min after administration (n ≥ 5 mice per group measured in duplicates; data are shown as mean ± s.d.); **P ≤ 0.01 and ***P ≤ 0.001 versus control. Data were analyzed by two-tailed unpaired t-test. d,e, Representative images and quantification of western blots to evaluate the effects of treatment with 10, 20 or 50 mg per kg (body weight) per day methazolamide on the levels of total tau (Tau5; d) and phosphorylated tau (PHF1; e) in the brains of Tg4510 mice. GAPDH was used as a loading control. Methazolamide reduces total and hyperphosphorylated tau levels compared with control treatment (n ≥ 5 mice per group; data are shown as mean ± s.e.m.); *P ≤ 0.05 and **P ≤ 0.01 versus control. Data were analyzed by two-tailed unpaired t-test.

Source data

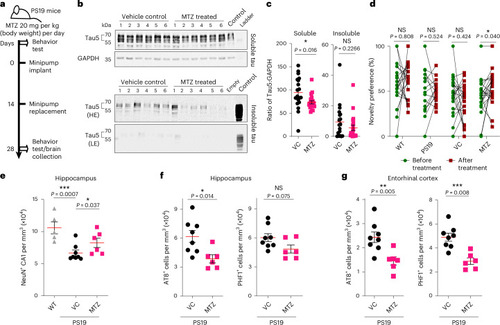
Methazolamide treatment reduces tau levels and neuron loss and improves object recognition in PS19 tau transgenic mice.

a, Scheme for methazolamide dosing in PS19 mice. Tau PS19 mice at 8–9 months were implanted with subcutaneous methazolamide-loaded osmotic minipumps (20 mg per kg (body weight) per day; ALZET Model 2002) for 28 days in total. Pumps were replaced once at day 14. Behavioral testing was performed once before implanting the minipump and subsequently at days 26 (habituation to arena) and 27 (novel object recognition testing) after treatment. b,c, Representative images (b) and quantification (c) of western blots to evaluate the effects of 20 mg per kg (body weight) per day methazolamide treatment on levels of tau (Tau5) in sarkosyl-soluble and sarkosyl-insoluble fractions from the cerebral cortex of PS19 mice compared with mice treated with vehicle only. The same soluble fraction from a vehicle control-treated mouse was run in parallel to insoluble fractions on every gel (b); HE, high exposure; LE, low exposure. GAPDH was used as a loading control. Methazolamide treatment significantly reduced the levels of soluble tau (soluble Tau5/GAPDH) compared with vehicle control treatment and diminished insoluble tau (insoluble Tau5/GAPDH) to a lesser extent (c). Insoluble fractions were normalized to control (n = 21 methazolamide-treated mice and n = 19 vehicle control-treated mice). Values are shown as mean ± s.e.m.; *P ≤ 0.05 versus vehicle control. Data were analyzed by two-tailed unpaired t-test; VC, vehicle control. d, A novel object recognition task was performed using PS19 mice (untreated) and wild-type littermates (untreated) in parallel to PS19 mice treated with methazolamide or vehicle control. All mice were assessed at 34 weeks and were reassessed at day 27. Wild-type and PS19 littermates that were not implanted with minipumps were assessed in parallel (n = 20 wild-type mice; n = 15 PS19 mice; n = 22 PS19 mice treated with methazolamide; n = 21 vehicle control-treated PS19 mice). The plot shows changes in scores from 34 weeks to 34 weeks + 27 days (after treatment) as the percentage of novelty preference analyzed using a Wilcoxon matched-pairs signed-rank test (nonparametric method) to compare before and after treatment novel object recognition task scores; *P ≤ 0.05 versus vehicle control. e, Unbiased stereological estimates of numbers of NeuN+ CA1 neurons in the hippocampus of PS19 mice and vehicle-treated and methazolamide-treated PS19 mice. Wild-type littermate brains were used as a positive control. Data in the plots represent mean ± s.e.m. (n = 8 vehicle-treated mice and n = 6 methazolamide-treated mice per group). Data were analyzed by one-tailed unpaired t-test. f,g, Effects of 20 mg per kg (body weight) per day methazolamide treatment on levels of phosphorylated tau, as detected by antibodies to AT8 and PHF1 in the hippocampus (CA1) and entorhinal cortex regions of brains of PS19 mice. Methazolamide treatment reduces hyperphosphorylated tau levels compared with vehicle control treatment. Data in the plots represent mean ± s.e.m. (n = 8 vehicle-treated mice and n = 6 methazolamide-treated mice per group). Data were analyzed by two-tailed unpaired t-test.

Source data

Acknowledgments
This image is the copyrighted work of the attributed author or publisher, and ZFIN has permission only to display this image to its users. Additional permissions should be obtained from the applicable author or publisher of the image. Full text @ Nat. Chem. Biol.