IMAGE

Fig. 5

ID
ZDB-IMAGE-250331-32
Source
Figures for Lopez et al., 2024
Image
Figure Caption

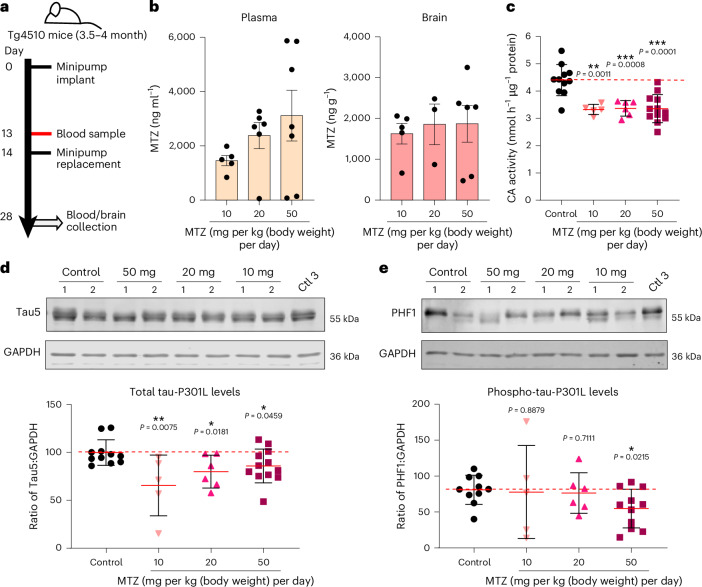
Fig. 5 CA inhibition reduces total and phospho-tau levels in Tg4510 tau transgenic mice.

a, Subcutaneous methazolamide-loaded osmotic minipumps (ALZET Model 2002) were implanted in 3.5- to 4-month-old Tg4510 mice (both sexes) for 28 days. Pumps were replaced once at day 14. To determine the human equivalent dose, three different doses of methazolamide (10, 20 and 50 mg per kg (body weight) per day) were used. At day 13, a blood sample was collected before implanting the second minipump. Terminal blood and brain samples were collected at day 28 (n = 5 for 10 mg, n = 6 for 20 mg, n = 12 for 50 mg and n = 11 for vehicle control mice). b, Graph representing the concentration of methazolamide in the plasma (ng ml–1) and brains (ng g−1) of Tg4510 transgenic mice treated with 10, 20 and 50 mg per kg (body weight) methazolamide for 28 days by subcutaneous osmotic minipumps (n = 5 mice per group (minimum); data are shown as mean ± s.e.m.). c, Effect of treatment with 10, 20 or 50 mg per kg (body weight) per day methazolamide on brain CA activity as determined by colorimetric enzymatic assay. Methazolamide reduced CA activity at all doses and had a prolonged effect, reducing CA activity in the brains of wild-type mice from 5 min after administration (n ≥ 5 mice per group measured in duplicates; data are shown as mean ± s.d.); **P ≤ 0.01 and ***P ≤ 0.001 versus control. Data were analyzed by two-tailed unpaired t-test. d,e, Representative images and quantification of western blots to evaluate the effects of treatment with 10, 20 or 50 mg per kg (body weight) per day methazolamide on the levels of total tau (Tau5; d) and phosphorylated tau (PHF1; e) in the brains of Tg4510 mice. GAPDH was used as a loading control. Methazolamide reduces total and hyperphosphorylated tau levels compared with control treatment (n ≥ 5 mice per group; data are shown as mean ± s.e.m.); *P ≤ 0.05 and **P ≤ 0.01 versus control. Data were analyzed by two-tailed unpaired t-test.

Source data

Acknowledgments
This image is the copyrighted work of the attributed author or publisher, and ZFIN has permission only to display this image to its users. Additional permissions should be obtained from the applicable author or publisher of the image. Full text @ Nat. Chem. Biol.