|
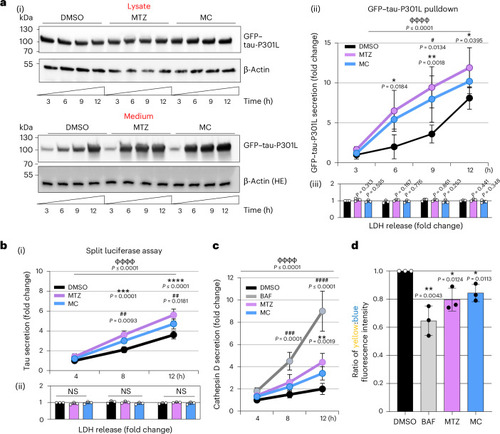
CA inhibition induces the secretion of tau via lysosomal exocytosis. a, GFP-Trap pulldown of extracellular tau from the medium of SH-SY5Y cells expressing GFP–tau-P301L after 24-h induction with 0.2 µg ml–1 doxycycline. Treatment with 30 μM methazolamide or 30 μM methocarbamol increased extracellular tau compared with medium from DMSO-treated cells. Immunoblots (i) show tau levels in cell lysates and immunoprecipitated tau from medium over 12 h (β-actin was used as the loading control for lysates). The relative quantification of the tau secretion rate (ii) is shown on the right. Values were normalized to DMSO at t = 3 h (data are shown as the mean of n = 3 biological replicates ± s.d.); *P ≤ 0.05 for methazolamide versus DMSO; *P ≤ 0.05 and **P ≤ 0.01 for methazolamide versus DMSO; #P ≤ 0.05 for methocarbamol versus DMSO. Data were analyzed by two-way ANOVA followed by Tukey’s multiple comparisons test (ɸɸɸɸP ≤ 0.0001). Quantification of LDH release was monitored from each medium fraction (iii; data are shown as the mean of n = 3 biological replicates ± s.d.). Data were analyzed by two-tailed Student’s t-test. b, Split luciferase complementation assay in stable SH-SY5Y cells expressing HiBit-tagged tau incubated in complete medium in the presence of DMSO, 30 μM methazolamide or 30 μM methocarbamol over 12 h. Drug treatment increased extracellular tau compared with treatment with DMSO (i) without affecting LDH release (ii). Values were normalized to the control sample (DMSO) at t = 4 h (i; data are shown as the mean of n = 3 biological replicates ± s.d.). Data were analyzed by two-way ANOVA (ɸɸɸɸP ≤ 0.0001), followed by Tukey’s multiple comparisons test, ***P ≤ 0.001 and ****P ≤ 0.0001 for methazolamide versus DMSO, ##P ≤ 0.01 for methocarbamol versus DMSO. For ii, the bars indicate LDH release (data are shown as the mean of n = 3 biological replicates ± s.d.). Data were analyzed by two-tailed Student’s t-test. c, Levels of cathepsin D in cell medium determined by ELISA after incubation of SH-SY5Y cells in complete medium with DMSO, 100 μM bafilomycin A1 (BAF), 30 μM methazolamide or 30 μM methocarbamol over 12 h. Values were normalized to DMSO at t = 4 h (data are shown as the mean of n = 3 biological replicates ± s.d.); **P ≤ 0.01 for methazolamide versus DMSO; ###P ≤ 0.001 and ####P ≤ 0.0001 for bafilomycin A1 versus DMSO. Data were analyzed by two-way ANOVA followed by Tukey’s multiple comparisons test (ɸɸɸɸP ≤ 0.0001). d, Lysosomal pH was analyzed in SH-SY5Y cells following incubation in complete medium with DMSO, 100 μM bafilomycin A1, 30 μM methazolamide or 30 μM methocarbamol for 6 h using LysoSensor DND-160. A reduced yellow-to-blue ratio is indicative of increased pH. Values were normalized to DMSO (data are shown as the mean of n = 3 biological replicates ± s.d.); *P ≤ 0.05 and **P ≤ 0.01 versus DMSO. Data were analyzed by two-tailed Student’s t-test; Ctl, control. Source data
|