
- Title
-
Necrostatin-1 as a Potential Anticonvulsant: Insights from Zebrafish Larvae Model of PTZ-Induced Seizures
- Authors
- Ravikumar, M., Durairaj, B., Uvarajan, D.
- Source
- Full text @ Mol. Neurobiol.
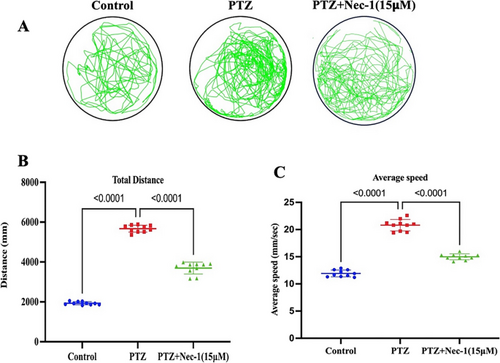
Modulation of RIPK1 selective inhibitor (Nec-1) on locomotor activity (time window = 10 min) in PTZ-induced epileptic zebrafish larvae (n = 10). A Movement trajectories. B Total distance traveled. C Average swimming speed. Pretreatment with Nec-1 effectively mitigated the substantial increase in locomotor activity observed in zebrafish larvae exposed to PTZ, as indicated by a reduction in both total distance traveled and average speed. Results are expressed as mean ± SD (n = 10). Data were analyzed by one-way ANOVA, followed by Tukey’s post hoc test PHENOTYPE:
|

Effect of selective RIPK1 inhibitor (Nec-1) on neuronal marker (c-Fos) level in PTZ-stimulated epileptic zebrafish larvae (n = 50). The figure illustrates the inhibitory effect of Nec-1 on c-Fos expression in zebrafish exposed to PTZ. Results are expressed as mean ± SD, each performed in triplicate. Data were analyzed by one-way ANOVA, followed by Tukey’s post hoc test |
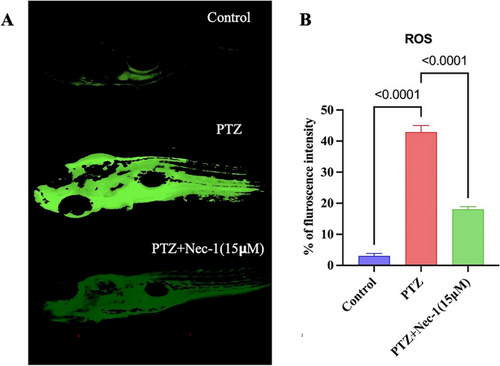
Nec-1 mitigates ROS production in PTZ-induced epileptic zebrafish larvae. A The ROS levels were measured by image analysis and fluorescence microscope. B Individual zebrafish fluorescence intensity was quantified using an ImageJ program. Evaluation of ROS levels using DCFH-DA fluorescent probe in zebrafish larvae at 7 dpf. Exposure to PTZ resulted in a significant elevation in ROS levels, whereas prior administration of Nec-1 (15 µM) effectively mitigated ROS generation. The images were acquired with an inverted fluorescent microscope (Optika IM3, Italy) with a magnification of × 10. Results are expressed as mean ± SD, each performed in triplicate (n = 15). Data were analyzed by one-way ANOVA, followed by Tukey’s post hoc test PHENOTYPE:
|
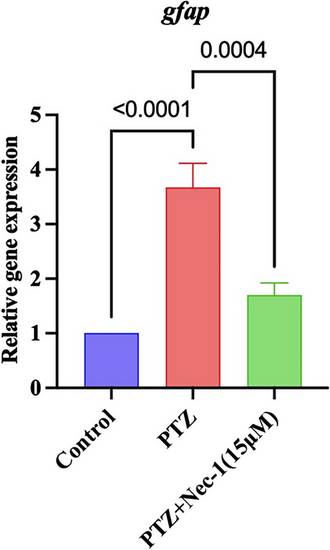
Effect of selective RIPK1 inhibitor (Nec-1) on astrocyte marker (GFAP) expression in PTZ-stimulated epileptic zebrafish larvae (n = 50). The figure illustrates the inhibitory effect of Nec-1 on GFAP gene expression in zebrafish exposed to PTZ. Results are expressed as mean ± SD, each performed in triplicate. Data were analyzed by one-way ANOVA, followed by Tukey’s post hoc test |
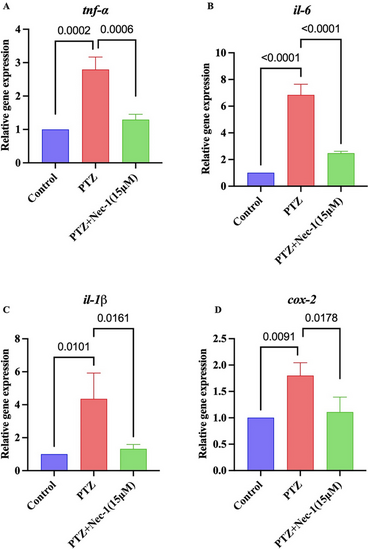
Effect of selective RIPK1 inhibitor (Nec-1) on A TNF-α, B IL-6, C IL-1β, and D COX-2 expression in PTZ-induced epileptic zebrafish larvae (n = 50). The figure illustrates the inhibitory effect of Nec-1 on TNF-α, IL-6, IL-1β, and COX-2 gene expression in zebrafish exposed to PTZ. Results are expressed as mean ± SD, each performed in triplicate. Data were analyzed by one-way ANOVA, followed by Tukey’s post hoc test |
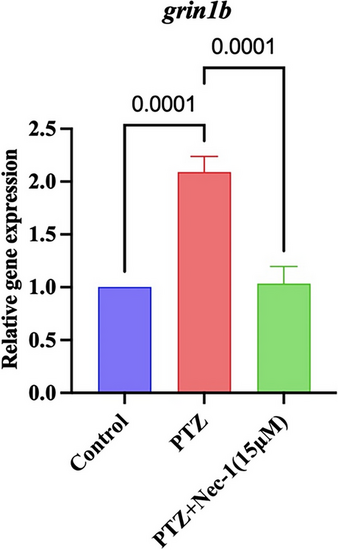
Effect of selective RIPK1 inhibitor (Nec-1) on GRIN1B expression in PTZ-stimulated epileptic zebrafish larvae (n = 50). The figure represents the suppressive effect of Nec-1 on GRIN1B gene expression in zebrafish larvae subjected to PTZ. Results are expressed as mean ± SD, each performed in triplicate. Data were analyzed by one-way ANOVA, followed by Tukey’s post hoc test |
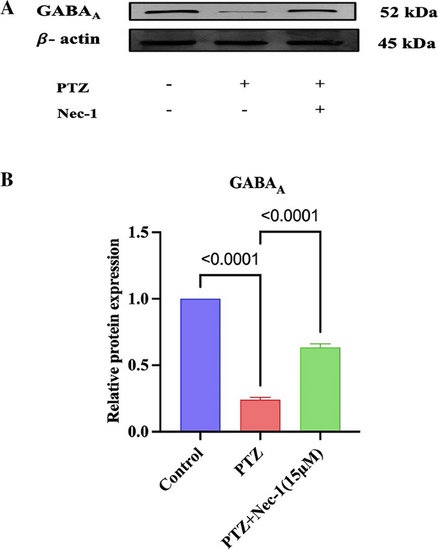
Quantification of GABAA receptor expression normalized to beta-actin. A Western blot analysis of GABAA B QuantitativeanalysesofGABAA. The figure illustrates the significant elevation in GABAA receptor expression in zebrafish larvae (n = 50) pretreated with Nec-1, indicating its potential as an anticonvulsant through modulation of TNFα/TNFR1 signaling. Results are expressed as mean ± SD, each performed in triplicate. Data were analyzed by one-way ANOVA, followed by Tukey’s post hoc test |
|