
- Title
-
Macrophages directly kill bladder cancer cells through TNF signaling as an early response to BCG therapy
- Authors
- Martínez-López, M.F., de Almeida, C.R., Fontes, M., Mendes, R.V., Kaufmann, S.H.E., Fior, R.
- Source
- Full text @ Dis. Model. Mech.
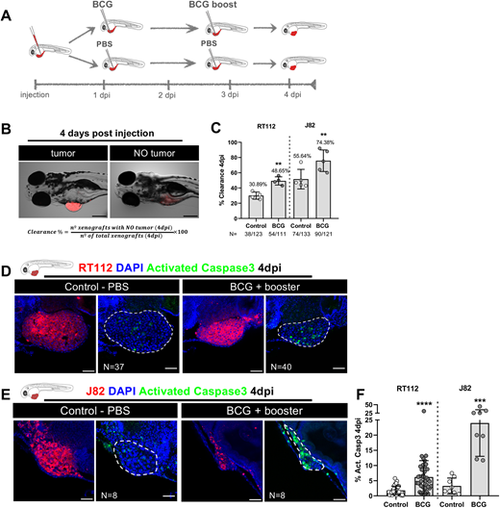
Zebrafish bladder cancer xenografts are susceptible to BCG immunotherapy. (A) Schematic representation of the BCG treatment protocol. (B) Representative brightfield images of xenografts with and without tumors at 4 days post injection (dpi). Human cancer cells were labelled with the Vybrant CM-DiI lipophilic stain (red) and the equation used for the calculation of clearance rate is shown. Scale bar: 250 µm. (C) Quantification of the percentage of clearance in NMIBC-RT112 and MIBC-J82 xenografts at 4 dpi. Bars indicate the results as mean±s.d. and each dot represents a full round of injections. N represents the number of xenografts without tumors at 4 dpi relative to the total number of xenografts at 4 dpi (**P<0.01; Fisher's exact test). (D,E) Representative confocal images of NMIBC-RT112 (D) and MIBC-J82 (E) control and BCG+booster-treated xenografts at 4 dpi. Human cancer cells were labelled with the Vybrant CM-DiI lipophilic stain (red), the apoptosis marker activated caspase-3 is in green and nuclei (DAPI counterstaining) in blue. White dashed regions outline the tumor. BCG were labelled with either the Deep Red Cell Tracker or the Vybrant CM-DiI lipophilic stains (not shown). In all images, anterior is to the left, posterior to the right, dorsal up and ventral down. Scale bars: 50 µm. (F) Quantification of the percentage of activated caspase-3-positive (apoptotic) cells to the total number of cells at 4 dpi. Bars indicate the results as mean±s.d. and each dot represents one xenograft pooled from two independent experiments. The numbers of analyzed xenografts are indicated in D,E. ***P<0.001; ****P<0.0001 (parametric unpaired two-tailed t-test). Note that the experiments presented in this figure and in Fig. S4 were performed in parallel; thus, they share the same set of controls and BCG+booster samples, and several transgenic backgrounds were used (see Table S1). |
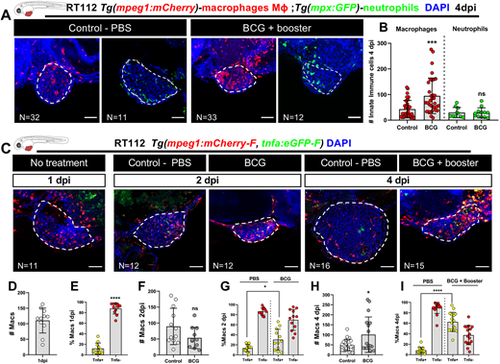
BCG modulates recruitment and polarization of macrophages in zebrafish bladder cancer xenografts. (A) Representative confocal images of macrophages (red) and neutrophils (green) in NMIBC-RT112 control and BCG+booster-treated xenografts, in which human cancer cells were labelled with the Deep Red Cell Tracker lipophilic stain (not shown). (B) Quantification of the absolute numbers of infiltrating macrophages and neutrophils at 4 dpi (***P=0.0003). (C) Representative confocal images of Tnfa expression (green) and macrophages (red) in NMIBC-RT112 control and BCG+booster-treated xenografts, in which human cancer cells were labelled with the Deep Red Cell Tracker lipophilic stain (not shown). In A,C, white dashed regions outline the tumor. BCG were labelled with either the Deep Red Cell Tracker or the Vybrant CM-DiI lipophilic stain (not shown). In all images, anterior is to the left, posterior to the right, dorsal up and ventral down. Scale bars: 50 µm. (D-I) Quantification of the absolute numbers of macrophages and the percentage of Tnfa-positive and Tnfa-negative macrophages in the tumor microenvironment at 1 dpi before treatment (****P<0.0001) (D,E), in control and BCG-treated xenografts at 2 dpi (ns, not significant, P≥0.05; *P=0.0190) (F,G), and in control and BCG+booster-treated xenografts at 4 dpi (*P<0.05; ****P<0.0001) (H,I). Bars in B,D-I indicate the results as mean±s.d. and each dot represents one xenograft pooled from two independent experiments. The numbers of analyzed xenografts are indicated in A,C. Data sets with a Gaussian distribution (B,D-I) were analyzed by parametric unpaired two-tailed t-test. Note that the quantitative data presented in B are also shown in Fig. 3C as these data concern the same sets of experiments and xenografts. These experiments were performed in parallel with those in Fig. 3; thus, they share the same controls, and several transgenic backgrounds were used (see Table S1). |
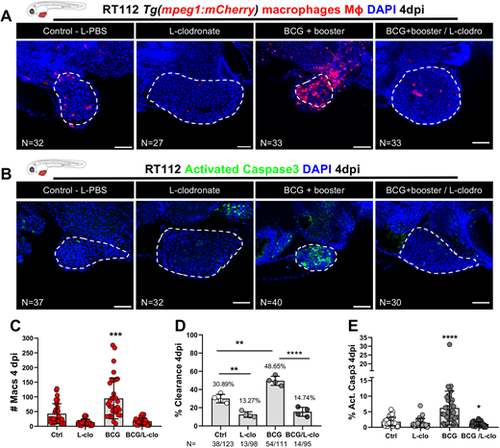
Macrophages are essential for susceptibility of zebrafish bladder cancer xenografts to BCG immunotherapy. (A) Representative confocal images of infiltrating macrophages (red) in BCG/L-clodronate experiments. (B) Representative confocal images of NMIBC-RT112 xenografts stained for the apoptosis marker activated caspase-3 (green) in BCG/L-clodronate experiments. In A,B, human cancer cells were labelled with the Deep Red Cell Tracker lipophilic stain (not shown), and BCG were labelled with either the Deep Red Cell Tracker or the Vybrant CM-DiI lipophilic stain (not shown). White dashed regions outline the tumor. In all images, anterior is to the left, posterior to the right, dorsal up and ventral down. Scale bars: 50 µm. (C) Quantification of the absolute numbers of infiltrating macrophages in BCG/L-clodronate experiments (***P=0.0001). Each dot represents one xenograft pooled from two independent experiments. (D) Quantification of the percentage of clearance in BCG/L-clodronate experiments at 4 dpi (**P<0.01; ****P<0.0001; Fisher's exact test). Each dot represents a full round of injections and N represents the number of xenografts without tumors at 4 dpi relative to the total number of xenografts at 4 dpi. (E) Quantification of the percentage of activated caspase-3-positive (apoptotic) cells in BCG/L-clodronate experiments at 4 dpi (*P=0.0102; ****P<0.0001). Each dot represents one xenograft pooled from three independent experiments. Bars indicate the results as mean±s.d. and the numbers of analyzed xenografts are indicated in A,B. Data sets that did not pass the D'Agostino–Pearson omnibus and Shapiro–Wilk normality tests were analyzed by nonparametric unpaired Mann–Whitney test (C,E). Unless stated otherwise, each experimental data set was challenged to the respective control. Additionally, the data sets in C,E were analyzed with Welch's one-way ANOVA with Games–Howell post hoc test in which P<0.0001. Xenografts represented in A,B correspond to the same sets of experiments and genetic background in which transgenic larvae were also labeled for activated caspase-3. Quantitative data shown in C are also shown in Fig. 2B as these data concern the same sets of experiments and xenografts. The experiments in this figure were performed in parallel with those in Fig. S5; thus, they share the same controls. Note that several transgenic backgrounds were used (see Table S1). |
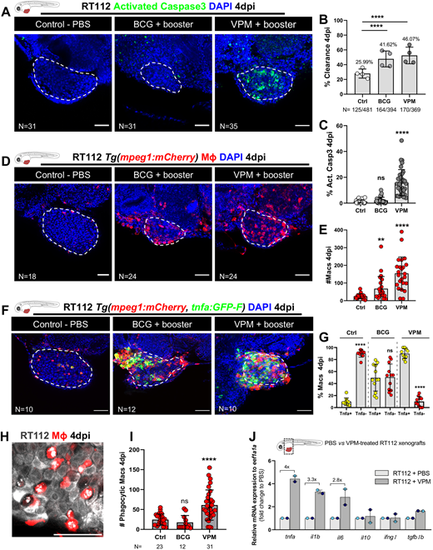
Zebrafish bladder cancer xenografts are susceptible to immunotherapy with the conventional and genetically modified BCG strains. (A) Representative confocal images of NMIBC-RT112 control and BCG+booster-treated or VPM1002+booster-treated xenografts. Human cancer cells were labelled with the Deep Red Cell Tracker lipophilic stain (not shown) and were stained for the apoptosis marker activated caspase-3 (green) at 4 dpi. (B) Quantification of the percentage of clearance in NMIBC-RT112 control and treated xenografts at 4 dpi (****P<0.0001; Fisher's exact test). Each dot represents a full round of injections in which N represents the number of xenografts without tumors at 4 dpi relative to the total number of xenografts at 4 dpi. (C) Quantification of the percentage of activated caspase-3-positive (apoptotic) cells in NMIBC-RT112 control and treated xenografts at 4 dpi (****P<0.0001). (D) Representative confocal images of infiltrating macrophages (red) in NMIBC-RT112 control and treated xenografts at 4 dpi. (E) Quantification of absolute numbers of infiltrating macrophages in NMIBC-RT112 control and treated xenografts at 4 dpi (**P=0.0032; ****P<0.0001). (F) Representative confocal images of Tnfa expression (green) and macrophages (red) in NMIBC-RT112 control and treated xenografts at 4 dpi. Human cancer cells were labelled with the Deep Red Cell Tracker lipophilic stain (not shown). In A,D,F, white dashed regions outline the tumor. BCG+booster-treated and VPM1002+booster-treated xenografts were labelled with either the Deep Red Cell Tracker or the Vybrant CM-DiI lipophilic stain (not shown). In all images, anterior is to the left, posterior to the right, dorsal up and ventral down. Scale bars: 50 µm. (G) Quantification of the percentage of Tnfa-positive and Tnfa-negative macrophages in the tumor microenvironment (TME) of NMIBC-RT112 control and BCG+booster-treated or VPM1002+booster-treated xenografts at 4 dpi (****P<0.0001). Each dot represents one xenograft pooled from two independent experiments. (H) Representative confocal image of macrophages (red) and NMIBC-RT112 cells labelled with the Deep Red Cell Tracker lipophilic stain. (I) Quantification of the number of phagocytic macrophages in NMIBC-RT112 control and treated xenografts at 4 dpi (****P<0.0001). Each dot represents one xenograft pooled from two independent experiments. (J) Relative gene expression levels of zebrafish tnfa, il1b, il6, il10, ifng1 and tgfb1b at 4 dpi in the TME of NMIBC-RT112 control and VPM1002+booster-treated xenografts. Bars indicate the fold change of expression to that in the control relative to expression of the housekeeping gene. Each dot represents the average of two or three technical replicates of one independent experiment. In B,C,E,G,I,J, bars indicate the results as mean±s.d. For C,E,G, the numbers of analyzed xenografts are indicated in A,D,F. Data sets with a Gaussian distribution (G) were analyzed by parametric unpaired two-tailed t-test, and data sets that did not pass the D'Agostino–Pearson omnibus and Shapiro–Wilk normality tests were analyzed by nonparametric unpaired Mann–Whitney test (C,E). Unless stated otherwise, each experimental data set was challenged to the respective control. Additionally, the data sets in C,E,I were analyzed with Welch's one-way ANOVA with Games–Howell post hoc test in which P<0.0001, P=0.0005 and P<0.0001, respectively. ns, not significant, P≥0.05. Note that the quantification presented in E is also shown in Fig. 7F, as these data concern the same sets of experiments and xenografts. Data from J are used for the mRNA expression comparison shown in Fig. 7H. Note that several transgenic backgrounds were used (see Table S1). |
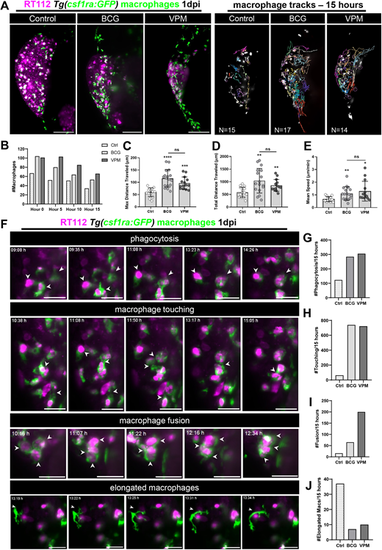
Live imaging reveals that BCG and VPM1002 vaccines stimulate macrophage kinetics and their intercellular interactions. (A) Left: representative maximum-intensity projections of NMIBC-RT112 cells labelled with the Deep Red Cell Tracker lipophilic stain (magenta) and for macrophages (green) at 15 h of light-sheet imaging. RT112 xenografts were imaged at 1 dpi right after BCG and VPM1002 injection. Right: representation of the macrophage tracks in which each colored line shows the path that an individual macrophage followed throughout 15 h. Scale bars: 100 µm. (B) Quantification of the absolute numbers of macrophages in NMIBC-RT112 control and BCG- or VPM1002-treated xenografts at different timepoints during imaging. (C) Quantification of the maximum distance travelled in micrometers (µm) by macrophages during 15 h after treatment in NMIBC-RT112 xenografts (***P=0.0002; ****P<0.0001). (D) Quantification of the total distance travelled in micrometers (µm) by macrophages during 15 h after treatment in NMIBC-RT112 xenografts (BCG, **P=0.0019; VPM, **P=0.0024). (E) Quantification of the mean speed in micrometers (µm) per minute travelled by macrophages during 15 h after treatment in NMIBC-RT112 xenografts (*P=0.0109; **P=0.0041). (F) Representative still images of light-sheet movies illustrating different macrophage interaction events. White arrowheads indicate each event analyzed. Scale bars: 25 µm. (G-J) Quantification of the number of phagocytic macrophages (G), the number of membrane touching events (H), the number of fusion events (I) and the number of elongated macrophages (J) observed in 15 h of imaging in NMIBC-RT112 xenografts. Bars indicate the results as mean±s.d. and each dot represents one macrophage. The numbers of analyzed xenografts are indicated in A. Data sets with a Gaussian distribution (C-E) were analyzed by parametric unpaired two-tailed t-test. Unless stated otherwise, each experimental data set was challenged to the respective control. Additionally, C-E were analyzed with Welch's one-way ANOVA with Games–Howell post hoc test in which P<0.0001, P=0.0008 and P=0.0019, respectively. ns, not significant, P≥0.05. |
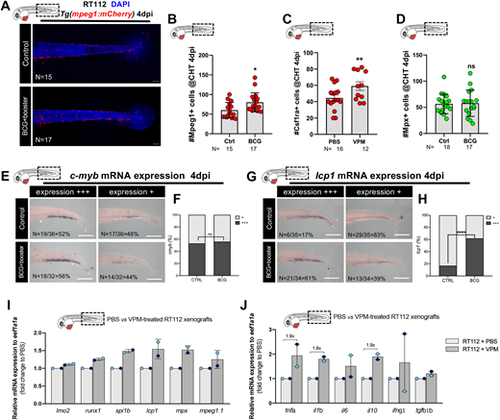
BCG induces myelopoiesis in zebrafish bladder cancer xenografts. (A) Representative confocal images of macrophages (red) in the caudal hematopoietic tissue (CHT) of NMIBC-RT112 control and BCG+booster-treated xenografts at 4 dpi. Scale bars: 50 µm. (B-D) Quantification of the absolute numbers of Mpeg1+ cells (*P=0.0155) (B), Csf1ra+ cells (**P=0.0064) (C) and Mpx+ cells (P=0.8611) (D) in the CHT of NMIBC-RT112 control and BCG+booster-treated xenografts at 4 dpi. Data are from one independent experiment. Bars indicate the results as mean±s.d. and each dot represents one xenograft. (E,F) mRNA expression of c-myb in the CHT of NMIBC-RT112 control and BCG+booster-treated xenografts at 4 dpi (E) and its corresponding quantification (F). Data were pooled from two independent experiments. (G,H) mRNA expression of lcp1 (l-plastin) in the CHT of NMIBC-RT112 control and BCG+booster-treated xenografts at 4 dpi (G) and its corresponding quantification (****P<0.001; Fisher's exact test) (H). Data are from one independent experiment. For E-H, the numbers of analyzed xenografts are indicated in the images. Scale bars: 250 µm. (I,J) Relative gene expression levels of zebrafish lmo2, runx1, spi1b, lcp1, mpx and mpeg1.1 (I) and tnfa, il1b, il6, il10, ifng1 and tgfb1b (J) at 4 dpi in the CHT of NMIBC-RT112 control and VPM1002+booster-treated xenografts. Bars indicate the fold change of expression to that in the control relative to housekeeping gene expression (mean±s.d.). Each dot represents the average of two or three technical replicates of one independent experiment. Data sets with a Gaussian distribution (B-D) were analyzed by parametric unpaired two-tailed t-test. Unless stated otherwise, each experimental data set was challenged to the respective control. ns, not significant, P≥0.05. In all images, anterior is to the left, posterior to the right, dorsal up and ventral down. Note that several transgenic backgrounds were used (see Table S1). |
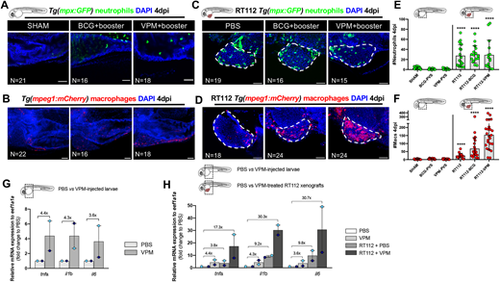
Bladder cancer cells are required for the recruitment of neutrophils and macrophages to the PVS in response to BCG immunotherapy. (A-D) Representative confocal images of neutrophils (green) and macrophages (red) of non-injected zebrafish larvae (A,B) and NMIBC-RT112 xenografts (C,D) at 4 dpi, in which BCG or VPM1002 were labelled with the Deep Red Cell Tracker lipophilic stain (not shown). White dashed regions outline the tumor. In all images, anterior is to the left, posterior to the right, dorsal up and ventral down. Scale bars: 50 µm. (E) Quantification of the absolute numbers of neutrophils of zebrafish larvae at 4 dpi (****P<0.0001). Note that the xenograft data shown here are also shown in Fig. S6 for analysis of the effects of BCG on neutrophil infiltration. (F) Quantification of the absolute numbers of macrophages of zebrafish larvae at 4 dpi (****P<0.0001). Neutrophil and macrophage data sets were compared against their corresponding sham control. Bars indicate the results as mean±s.d. and each dot represents one xenograft pooled from three independent experiments. Note that the xenograft data shown here for comparison are also shown in Fig. 4E, as these data concern the same sets of experiments/xenografts. (G) Relative gene expression levels of zebrafish tnfa, il1b and il6 at 6 days post fertilization (dpf) in the trunk region of non-injected zebrafish larvae (control versus VPM1002+booster). (H) Relative gene expression levels of zebrafish tnfa, il1b and il6 at 6dpf/4 dpi in the trunk region of non-injected zebrafish larvae (control versus VPM1002+booster injected) or NMIBC-RT112 xenografts (control versus VPM1002+booster), considering PBS-treated larvae as the basal control to normalize values. This graph includes data also presented in Fig. 4J. Bars in G,H indicate the fold change of expression to that in the control relative to housekeeping gene expression (mean±s.d.). Each dot represents the average of two or three technical replicates of one independent experiment. Data sets did not pass the D'Agostino–Pearson omnibus and Shapiro–Wilk normality tests were analyzed by nonparametric unpaired Mann–Whitney test (E,F). Each experimental data set was challenged to the sham control. Note that several transgenic backgrounds were used (see Table S1). |
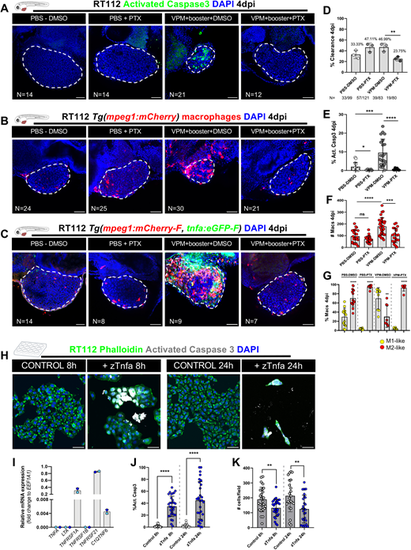
VPM1002 induction of bladder cancer cell clearance and apoptosis depends on TNF signaling. (A) Representative confocal images of NMIBC-RT112 control and VPM1002-treated xenografts exposed to either DMSO or pentoxifylline (PTX), in which human cancer cells were labelled with the Deep Red Cell Tracker lipophilic stain (not shown) and for the apoptosis marker activated caspase-3 (green) at 4 dpi. (B) Representative confocal images of infiltrating macrophages (red) in NMIBC-RT112 control and VPM1002+booster-treated xenografts exposed to either DMSO or PTX at 4 dpi. (C) Representative confocal images of Tnfa expression (green) and macrophages (red) in NMIBC-RT112 control and VPM1002+booster-treated xenografts exposed to either DMSO or PTX at 4 dpi. In A-C, white dashed regions outline the tumor. In all images, anterior is to the left, posterior to the right, dorsal up and ventral down. Scale bars: 50 µm. (D) Quantification of the percentage of clearance in NMIBC-RT112 control and VPM1002+booster-treated xenografts exposed to either DMSO or PTX at 4 dpi (**P=0.0031; Fisher's exact test). Each dot represents a full round of injections in which N represents the number of xenografts without tumors at 4 dpi relative to the total number of xenografts at 4 dpi. (E) Quantification of the percentage of activated caspase-3-positive (apoptotic) cells in NMIBC-RT112 control and VPM1002-treated xenografts exposed to either DMSO or PTX at 4 dpi (*P=0.0165; ***P=0.0002; ****P<0.0001). Each dot represents one xenograft pooled from three independent experiments. (F) Quantification of absolute numbers of infiltrating macrophages in NMIBC-RT112 control and VPM1002-treated xenografts exposed to either DMSO or PTX at 4 dpi (***P=0.0002; ****P<0.0001). Macrophages were quantified using Tg(mpeg1:mCherry) and Tg(csf1ra:GFP). Each dot represents one xenograft pooled from three independent experiments. (G) Quantification of the percentage of M1-like (Tnfa- or NFκB-positive macrophages, Mpeg1+) and M2-like (Tnfa- or NFκB-negative macrophages, Mpeg1+) in the TME of NMIBC-RT112 control and VPM1002-treated xenografts exposed to either DMSO or PTX at 4 dpi (**P=0.0025; ****P<0.0001). Each dot represents one xenograft pooled from two independent experiments. (H) Representative confocal images of control and zebrafish Tnfa (zTnfa)-treated NMIBC-RT112 cells stained for the actin filament marker phalloidin (green), activated caspase-3 (white) and nuclei (DAPI counterstaining, blue). Scale bars: 50 µm. (I) Relative in vitro gene expression levels of human TNFA, LTA, TNFRSF1A, TNFRSF1B, TNFRSF21 and C1QTNF6 in the NMIBC-RT112 cell line. Bars indicate the fold change of expression relative to that of the housekeeping gene. Each dot represents the average of two or three technical replicates of one independent experiment. (J) Quantification of the percentage of activated caspase-3-positive cells per field in control and zTnfa-treated NMIBC-RT112 cells at 8 and 24 h post treatment. Each dot represents one random field of view (****P<0.0001). (K) Quantification of the mean absolute number of cells per field in control and zTnfa-treated NMIBC-RT112 cells at 8 and 24 h post treatment. Each dot represents one quantified well (**P<0.01). In J,K, data were pooled from two independent experiments. In D-G,I-K, bars indicate the results as mean±s.d. Data sets with a Gaussian distribution (F,G,J,K) were analyzed by parametric unpaired two-tailed t-test and data sets that did not pass the D'Agostino–Pearson omnibus and Shapiro–Wilk normality tests were analyzed by nonparametric unpaired Mann–Whitney test (E). Unless stated otherwise, each experimental data set was challenged to the respective control. Additionally, data sets in E-G were analyzed with Welch's one-way ANOVA with Games–Howell post hoc test in which P<0.0001 for the three conditions. ns, not significant, P≥0.05. Note that several transgenic backgrounds were used (see Table S1). |