Fig. 1
- ID
- ZDB-FIG-240808-38
- Publication
- Martínez-López et al., 2024 - Macrophages directly kill bladder cancer cells through TNF signaling as an early response to BCG therapy
- Other Figures
- All Figure Page
- Back to All Figure Page
|
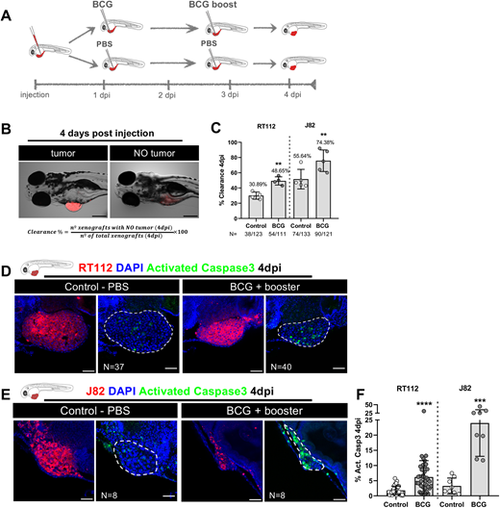
Zebrafish bladder cancer xenografts are susceptible to BCG immunotherapy. (A) Schematic representation of the BCG treatment protocol. (B) Representative brightfield images of xenografts with and without tumors at 4 days post injection (dpi). Human cancer cells were labelled with the Vybrant CM-DiI lipophilic stain (red) and the equation used for the calculation of clearance rate is shown. Scale bar: 250 µm. (C) Quantification of the percentage of clearance in NMIBC-RT112 and MIBC-J82 xenografts at 4 dpi. Bars indicate the results as mean±s.d. and each dot represents a full round of injections. N represents the number of xenografts without tumors at 4 dpi relative to the total number of xenografts at 4 dpi (**P<0.01; Fisher's exact test). (D,E) Representative confocal images of NMIBC-RT112 (D) and MIBC-J82 (E) control and BCG+booster-treated xenografts at 4 dpi. Human cancer cells were labelled with the Vybrant CM-DiI lipophilic stain (red), the apoptosis marker activated caspase-3 is in green and nuclei (DAPI counterstaining) in blue. White dashed regions outline the tumor. BCG were labelled with either the Deep Red Cell Tracker or the Vybrant CM-DiI lipophilic stains (not shown). In all images, anterior is to the left, posterior to the right, dorsal up and ventral down. Scale bars: 50 µm. (F) Quantification of the percentage of activated caspase-3-positive (apoptotic) cells to the total number of cells at 4 dpi. Bars indicate the results as mean±s.d. and each dot represents one xenograft pooled from two independent experiments. The numbers of analyzed xenografts are indicated in D,E. ***P<0.001; ****P<0.0001 (parametric unpaired two-tailed t-test). Note that the experiments presented in this figure and in Fig. S4 were performed in parallel; thus, they share the same set of controls and BCG+booster samples, and several transgenic backgrounds were used (see Table S1). |

