
|
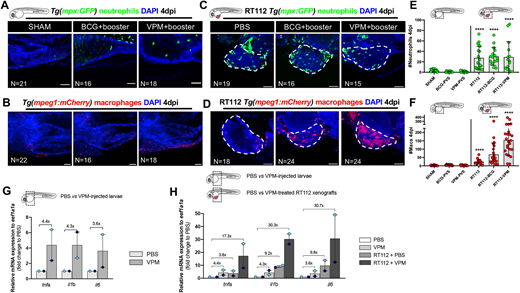
Fig. 7 Bladder cancer cells are required for the recruitment of neutrophils and macrophages to the PVS in response to BCG immunotherapy. (A-D) Representative confocal images of neutrophils (green) and macrophages (red) of non-injected zebrafish larvae (A,B) and NMIBC-RT112 xenografts (C,D) at 4 dpi, in which BCG or VPM1002 were labelled with the Deep Red Cell Tracker lipophilic stain (not shown). White dashed regions outline the tumor. In all images, anterior is to the left, posterior to the right, dorsal up and ventral down. Scale bars: 50 µm. (E) Quantification of the absolute numbers of neutrophils of zebrafish larvae at 4 dpi (****P<0.0001). Note that the xenograft data shown here are also shown in Fig. S6 for analysis of the effects of BCG on neutrophil infiltration. (F) Quantification of the absolute numbers of macrophages of zebrafish larvae at 4 dpi (****P<0.0001). Neutrophil and macrophage data sets were compared against their corresponding sham control. Bars indicate the results as mean±s.d. and each dot represents one xenograft pooled from three independent experiments. Note that the xenograft data shown here for comparison are also shown in Fig. 4E, as these data concern the same sets of experiments/xenografts. (G) Relative gene expression levels of zebrafish tnfa, il1b and il6 at 6 days post fertilization (dpf) in the trunk region of non-injected zebrafish larvae (control versus VPM1002+booster). (H) Relative gene expression levels of zebrafish tnfa, il1b and il6 at 6dpf/4 dpi in the trunk region of non-injected zebrafish larvae (control versus VPM1002+booster injected) or NMIBC-RT112 xenografts (control versus VPM1002+booster), considering PBS-treated larvae as the basal control to normalize values. This graph includes data also presented in Fig. 4J. Bars in G,H indicate the fold change of expression to that in the control relative to housekeeping gene expression (mean±s.d.). Each dot represents the average of two or three technical replicates of one independent experiment. Data sets did not pass the D'Agostino–Pearson omnibus and Shapiro–Wilk normality tests were analyzed by nonparametric unpaired Mann–Whitney test (E,F). Each experimental data set was challenged to the sham control. Note that several transgenic backgrounds were used (see Table S1).