
|
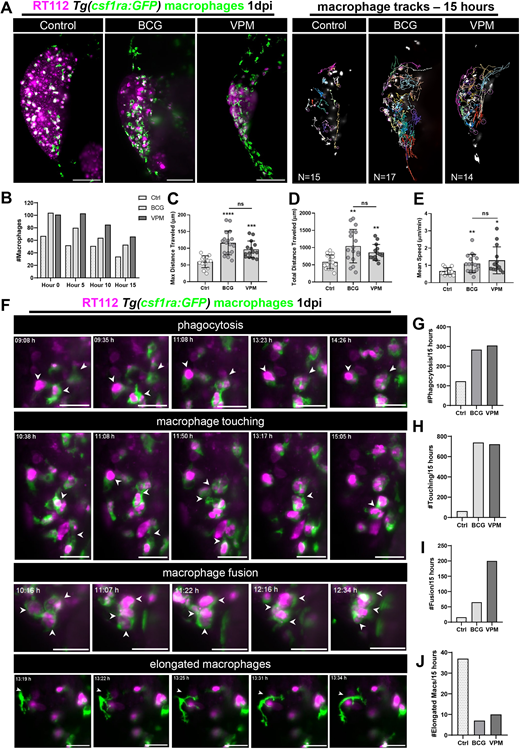
Fig. 5 Live imaging reveals that BCG and VPM1002 vaccines stimulate macrophage kinetics and their intercellular interactions. (A) Left: representative maximum-intensity projections of NMIBC-RT112 cells labelled with the Deep Red Cell Tracker lipophilic stain (magenta) and for macrophages (green) at 15 h of light-sheet imaging. RT112 xenografts were imaged at 1 dpi right after BCG and VPM1002 injection. Right: representation of the macrophage tracks in which each colored line shows the path that an individual macrophage followed throughout 15 h. Scale bars: 100 µm. (B) Quantification of the absolute numbers of macrophages in NMIBC-RT112 control and BCG- or VPM1002-treated xenografts at different timepoints during imaging. (C) Quantification of the maximum distance travelled in micrometers (µm) by macrophages during 15 h after treatment in NMIBC-RT112 xenografts (***P=0.0002; ****P<0.0001). (D) Quantification of the total distance travelled in micrometers (µm) by macrophages during 15 h after treatment in NMIBC-RT112 xenografts (BCG, **P=0.0019; VPM, **P=0.0024). (E) Quantification of the mean speed in micrometers (µm) per minute travelled by macrophages during 15 h after treatment in NMIBC-RT112 xenografts (*P=0.0109; **P=0.0041). (F) Representative still images of light-sheet movies illustrating different macrophage interaction events. White arrowheads indicate each event analyzed. Scale bars: 25 µm. (G-J) Quantification of the number of phagocytic macrophages (G), the number of membrane touching events (H), the number of fusion events (I) and the number of elongated macrophages (J) observed in 15 h of imaging in NMIBC-RT112 xenografts. Bars indicate the results as mean±s.d. and each dot represents one macrophage. The numbers of analyzed xenografts are indicated in A. Data sets with a Gaussian distribution (C-E) were analyzed by parametric unpaired two-tailed t-test. Unless stated otherwise, each experimental data set was challenged to the respective control. Additionally, C-E were analyzed with Welch's one-way ANOVA with Games–Howell post hoc test in which P<0.0001, P=0.0008 and P=0.0019, respectively. ns, not significant, P≥0.05.